Kernel Instrumentation Profiler
A Kernel instrumentation profiler uses a subset of the software tools and libraries included in the Linux® kernel, for monitoring the actions made by the kernel to manage the execution of processes running on the SoC hardware. SoC Blockset™ features use LTTng, an open source tracing framework for Linux, as a Kernel instrumentation profiler to monitor the execution of tasks and events of the Simulink® model deployed on the SoC hardware. For more information, see the LTTng website.
Unlike a code instrumentation profiler, a kernel instrumentation profiler directly measures the conditions and changes in state for all tasks by monitoring the Linux OS kernel. This diagram shows the measurements made in a multitasking process with high and low priority tasks.
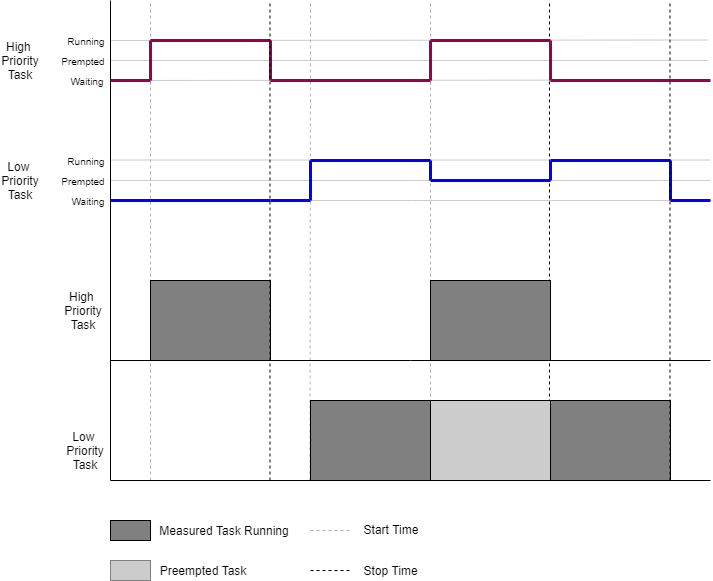
When a high priority task preempts a low priority task, the low priority task enters into the Preempted state and the high priority task enters into the Running state. After the high priority task completes execution, the scheduler resumes the preempted low priority task.
When using a kernel instrumentation profiler, the LTTng tracing framework traces the task state transitions directly from the Linux kernel and gives accurate task execution time. In comparison, when you use a code instrumentation profiler, it can incorrectly include the kernel latency in the execution time of the task.
Kernel instrumentation profiling provides these advantages.
High accuracy of timing measurements
Knowledge of task execution and task state transition directly from the kernel
CPU information of the processor core where the task executes
Limitations
You can perform kernel instrumentation profiling only on SoC hardware that runs using a Linux OS.
Kernel instrumentation profiling for an unlimited time duration on hardware with high task rate models could result in packet loss of profiling data streamed from hardware. For more information, see Task profiling on processor.