Model Noise
Amplifier and Mixer Noise Specifications
You only need to specify noise information for the physical amplifier and mixer blocks that generate noise other than resistor noise. For the other blocks, the blockset calculates the noise automatically based on the resistor values.
You define noise for the physical amplifier and mixer blocks through one of the following specifications:
Spot noise data in the data source.
Spot noise data in the block dialog box.
Spot noise data (
rfdata.noise) object in the block dialog box.Frequency-independent noise figure, noise factor, or noise temperature value in the block dialog box.
Frequency-dependent noise figure data (
rfdata.nf) object in the block dialog box.
The following table summarizes the noise specification options for each type of physical amplifier and mixer block.
| Block | Noise Specification |
|---|---|
| General Amplifier | Spot noise data (using a Touchstone, P2D, S2D, or AMP data file) OR Spot noise data, noise
figure value, noise factor value, noise temperature value,
|
S-Parameters Amplifier Y-Parameters Amplifier Z-Parameters Amplifier | Spot noise data, noise figure value, noise factor value, noise
temperature value, rfdata.noise, or
rfdata.nf object in the block dialog
box |
| General Mixer | Spot noise data (using a Touchstone, P2D, S2D, or AMP data file) OR Spot noise data, noise
figure value, noise factor value, noise temperature value,
|
S-Parameters Mixer Y-Parameters Mixer Z-Parameters Mixer | Spot noise data, noise figure value, noise factor value, noise
temperature value, rfdata.noise, or
rfdata.nf object in the block dialog
box |
Add Noise to Your System
To simulate the noise of a physical subsystem, you perform the following tasks:
Specify or Import Noise Data
The method you use to add noise data to a block depends on whether you are specifying noise data manually or importing spot-noise data.
The following table provides instructions for adding noise data.
| Noise Specification | Instructions |
|---|---|
| Frequency-independent noise figure | In the Noise Data tab of the block
dialog box, set the Noise type parameter to
Noise figure, and enter the noise
figure value in the Noise figure (dB)
parameter. |
| Frequency-dependent noise figure | In the Noise Data tab of the block
dialog box, set the Noise type parameter to
Noise figure, and enter the name
of the rfdata.nf object in the
Noise figure (dB) parameter. |
| Noise factor | In the Noise Data tab of the block
dialog box, set the Noise type parameter to
Noise factor, and enter the noise
factor value in the Noise factor
parameter. |
| Noise temperature | In the Noise Data tab of the block
dialog box, set the Noise type parameter to
Noise temperature, and enter the
noise temperature value in the Noise temperature
(K) parameter. |
| Spot noise data (in a block dialog box) | In the Noise Data tab of the block
dialog box, set the Noise type parameter to
Spot noise data. Enter the spot
noise information in the Minimum noise figure
(dB), Optimal reflection
coefficient, and Equivalent normalized
noise resistance parameters. |
| Spot noise data (from a data object) | In the Noise Data tab of the block
dialog box, set the Noise type parameter to
Noise figure and enter the name
of the rfdata.noise object in the
Noise figure (dB) parameter. |
| Spot noise data (from a file) | Import file data that includes noise information into the Data file or RFCKT object parameter of the General Amplifier or General Mixer block. |
Note
If you import file data with no noise information into a General Amplifier or General Mixer block, the Noise Data tab lets you add noise data manually in the block dialog box.
Add Noise to the Simulation
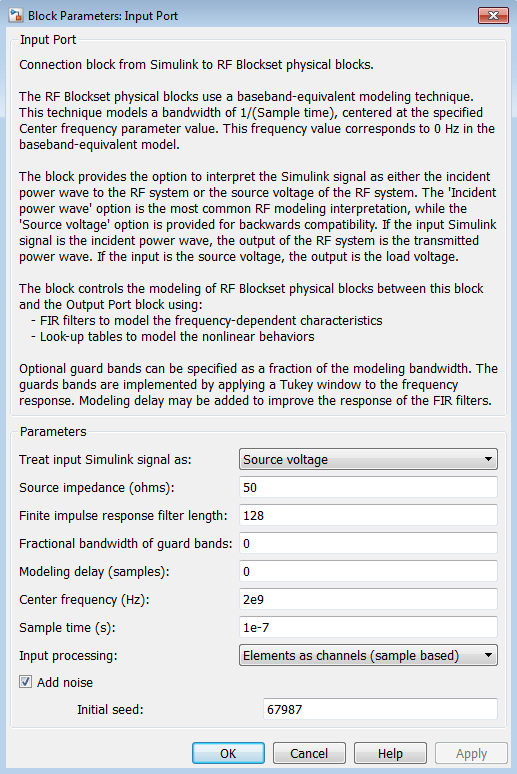
To include noise in the simulation, you must select the Add noise check box on the Input Port block dialog box. This check box is selected by default.
For information on how the blockset simulates noise, see Model Noise in an RF System.
Plot Noise
RF Blockset™ Equivalent Baseband software models communications systems. The noise in these systems has a very small amplitude, typically from 1e-6 to 1e-12 Watts. In contrast, the default signal power of a Communications Toolbox™ modulator block is 1 Watt at a nominal 1 ohm. Therefore, the signal-to-noise ratio in an RF system simulation is large, making it difficult to view the noise that the RF system adds to your signal.
To display the noise on a plot, you might need to attenuate the signal amplitude to a value within a couple orders of magnitude of the noise.
See Also
Input Port | Output Port | General Amplifier