Access Project Data from MATLAB Command Window
Signal Integrity Toolbox™ allows you to sweep the full range of a SerDes model settings and operating conditions with relatively simple steps. The short simulation times for IBIS-AMI models make it feasible to run many simulations. But you still need to evaluate the results looking at the waveforms and tables from thousands of simulations and possibly create some kind of reports. You can access the read-only project data from the MATLAB® command window to create your own evaluation environment.
To access the project data, you can use six classes to create specific objects. All the objects are linked, allowing you to navigate through the project and extract general or more in depth information.
| Class | Description |
|---|---|
SignalIntegrityProject | Create a project object. |
SignalIntegrityInterface | Create an interface object. |
SignalIntegritySheet | Create a sheet object. |
SignalIntegrityState | Create a state object. |
SignalIntegritySimulation | Create a simulation object. |
SignalIntegrityWaveform | Create a waveform object. |
The class hierarchy and some outputs are shown:

Plot Waveform and Extract Data Points from MIPI M-PHY Channel Project
This example shows how to create a SignalIntegrityProject object from a MIPI M-PHY project. You can access the project interface, extract the simulation results and plot the waveforms.
Download the MIPI M-PHY project.
openSignalIntegrityKit('MIPI_M_PHY')
Simulate the MIPI_G1_M_PHY_Single_Channel schematic sheet. Run statistical analysis simulations.
Close any open Serial Link Designer or Parallel Link Designer app session.
Create a project object from the MIPI_M_PHY project.
sip = SignalIntegrityProject('MIPI_M_PHY',ReadOnly=true)
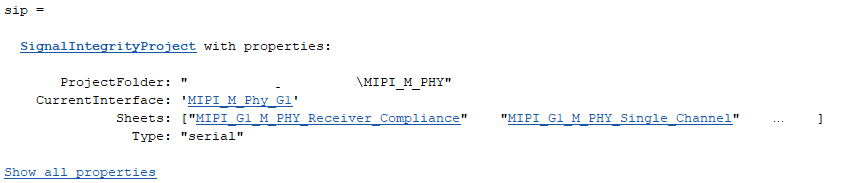
Create an interface object from the current interface of the project object.
int = sip.CurrentInterface

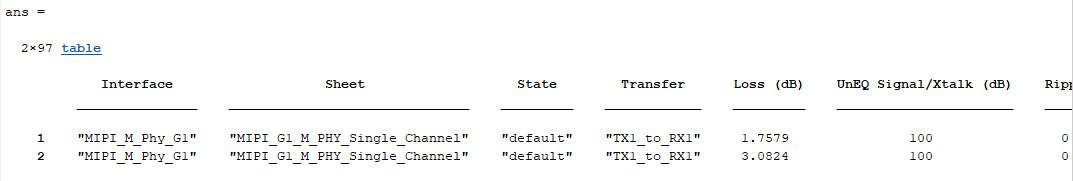
Extract the simulation results from the current interface.
int.Results
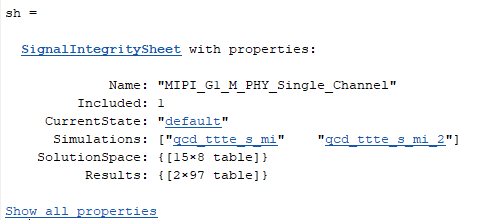
Create a sheet object from the MIPI_G1_M_PHY_Single_Channel interface.
sh = int.Sheets(2)
Extract the solution space for the given sheet.
sh.SolutionSpace

Create a simulation object from the sheet object.
sim = sh.Simulations(1)

Create a waveform object from the simulation object.
w = sim.Waveforms(1)

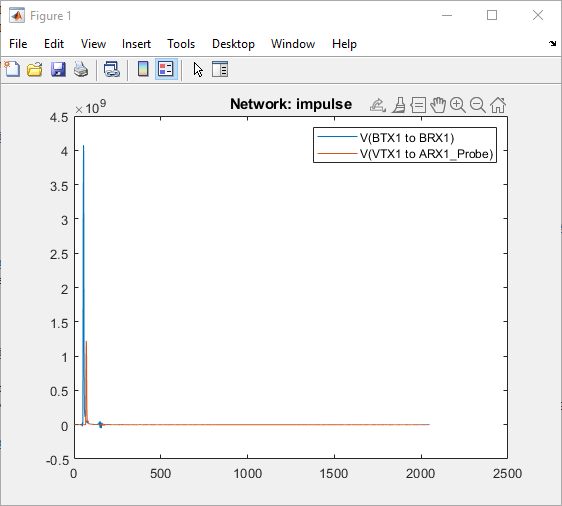
Plot the waveform and extract the data points.
w.plot
w.table

See Also
SignalIntegrityProject | SignalIntegrityInterface | SignalIntegritySheet | SignalIntegrityState | SignalIntegritySolutionSpace | SignalIntegritySimulation | SignalIntegrityWaveform