Tile Simulink Diagrams
This example shows how to create a report with a large diagram that spans across multiple pages.
Create Report with Image Tiles
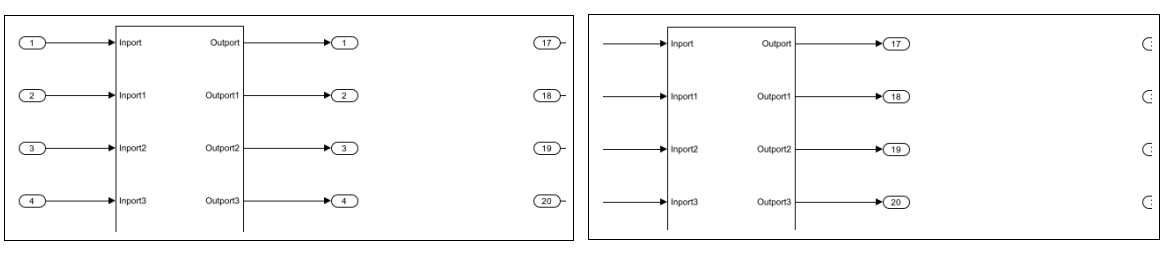
Open a model with a large diagram.
model = 'slreportgen_demo_big_diagram';
open_system(model);
Create large image file to split into tiles.
imgFile = [model '.png'];
print('-dpng', ['-s' model], imgFile);
Create and open a report.
% To create a Word report, change the output type from "pdf" to "docx".
% To create an HTML report, change "pdf" to "html" or "html-file for
% a multifile or single-file report, respectively.
rpt = slreportgen.report.Report('myreport2', 'pdf');
open(rpt);
Get the page layout information.
pageLayout = rpt.Document.CurrentPageLayout;
pageSize = pageLayout.PageSize;
pageMargins = pageLayout.PageMargins;
Set the page header and footer to 0 inches to maximize space.
pageMargins.Header = '0in';
pageMargins.Footer = '0in';
Determine the image tile size that fits onto the page. The optimal tile size is the page size minus the page margins, gutters, headers and footers. Also, adjust the tile height to allow 0.5 inches for the caption. Note that for PDF documents, MATLAB Report Generator defines one inch as equal to 96 pixels.
dpi = 96;
units = mlreportgen.utils.units;

tileHeight = units.toPixels(pageSize.Height, 'Resolution', dpi) ...
    - units.toPixels(pageMargins.Top, 'Resolution', dpi) ...
    - units.toPixels(pageMargins.Bottom, 'Resolution', dpi) ...
    - units.toPixels(pageMargins.Header, 'Resolution', dpi) ...
    - units.toPixels(pageMargins.Footer, 'Resolution', dpi) ...
    - units.toPixels('0.5in', 'Resolution', dpi);

tileWidth = units.toPixels(pageSize.Width, 'Resolution', dpi) ...
    - units.toPixels(pageMargins.Left, 'Resolution', dpi) ...
    - units.toPixels(pageMargins.Right, 'Resolution', dpi) ...
    - units.toPixels(pageMargins.Gutter, 'Resolution', dpi);

tileSize = [tileWidth tileHeight];
Call the sliceImage local function (see below) to slice the large image file into image tiles.
tiles = sliceImage(imgFile, [tileWidth tileHeight]);
Add the tile images to the report. Also, add a caption to indicate where the tile image belongs in relation to the overall image.
for i = 1:numel(tiles)
    tile = tiles{i};
    formalImage = mlreportgen.report.FormalImage(tile.File);
    formalImage.ScaleToFit = false;
    formalImage.Caption = sprintf('row: %d, col: %d', tile.Row, tile.Col);
    add(rpt, formalImage);
end
Generate and display the report.
close(rpt);
rptview(rpt);
Define sliceImage Local Function
To slice an image file into tiles, read in the image file and copy tile-size parts into multiple image files.
function tiles = sliceImage(imgFile, tileSize)
    % Read in the image file and determine the number of row and column
    % tiles. Note that the image data is row-major, where the rows are
    % specified first and the columns are second.
    img = imread(imgFile);
    imgSize = size(img);

    imgRows = imgSize(1); % image height
    imgCols = imgSize(2); % image width

    tileNumRows = tileSize(2); % tile height
    tileNumCols = tileSize(1); % tile width

    numCols = ceil(imgCols / tileNumCols);
    numRows = ceil(imgRows / tileNumRows);

    % Preallocate the tile data structures.
    tiles = cell(1, numCols*numRows);

    % Determine the base filename to create the tile image filenames.
    [fPath, fName, fExt] = fileparts(imgFile);
    tileName = fullfile(fPath, fName);

    % Iterate through all rows and columns.
    count = 0;
    for rowIdx = 1:numRows
        for colIdx = 1:numCols
            % Determine the starting and ending image data indices to copy
            % into the tile image.  At the edges, the ending indices are
            % the number of rows and number of columns.
            rowStart = (rowIdx - 1) * tileNumRows + 1;
            rowEnd = rowStart + tileNumRows - 1;

            colStart = (colIdx - 1) * tileNumCols + 1;
            colEnd = colStart + tileNumCols - 1;

            if (rowEnd >= imgRows)
                rowEnd = imgRows;
            end
            nTileRows = rowEnd - rowStart + 1;

            if (colEnd >= imgCols)
                colEnd = imgCols;
            end
            nTileCols = colEnd - colStart + 1;

            % Copy the tile image data onto a white image tile.
            tileImg = uint8(255 * ones(tileNumRows, tileNumCols, 3));
            tileImg(1:nTileRows, 1:nTileCols, :) = img(rowStart:rowEnd,...
                colStart:colEnd, :);

            % Write out the image tile.
            outFile = sprintf('%s_%d_%d.%s', tileName, rowIdx, colIdx, fExt);
            imwrite(tileImg, outFile);

            % Create the tile data structure to describe the tile.
            count = count + 1;
            tiles{count} = struct( ...
                'File', outFile, ...
                'Row', rowIdx, ...
                'Col', colIdx);
        end
    end
end