이 페이지는 기계 번역을 사용하여 번역되었습니다. 영어 원문을 보려면 여기를 클릭하십시오.
Polyspace Access 웹 인터페이스의 코드 메트릭 대시보드
Polyspace®가 계산하는 코드 복잡성 지표를 보려면 Code Metrics 대시보드를 사용하세요. Code Metrics (Polyspace Bug Finder) 항목을 참조하십시오.
Polyspace는 코드 메트릭 계산(-code-metrics) (Polyspace Bug Finder) 옵션을 사용할 때만 분석 중에 코드 복잡성 메트릭을 계산합니다.
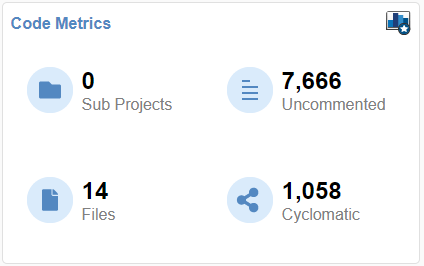
Project Explorer에서 프로젝트를 선택하세요. Project Overview 대시보드의 Code Metrics 카드를 사용하면 다음 코드 메트릭에 대한 빠른 개요를 얻을 수 있습니다.
Number of Files(Polyspace Bug Finder) (Files)Number of Lines Without Comment(Polyspace Bug Finder) (Uncommented)Cyclomatic Complexity(Polyspace Bug Finder) (Cyclomatic)
Project Explorer에서 폴더를 선택하면 Code Metrics 카드에 다음이 표시됩니다.
해당 폴더에 있는 Sub Projects의 수. 이 숫자에는 최상위 폴더 바로 아래(한 수준)에 있는 하위 프로젝트만 포함됩니다.
귀하가 Contributor, Owner, 또는 Administrator인 모든 레벨의 모든 하위 프로젝트에 대한 카드의 다른 메트릭의 집계입니다.
Code Metrics 대시보드를 열려면 툴스트립의 Dashboard 섹션에서 Code Metrics 아이콘을 클릭하세요. 또는 Project Overview 대시보드에서 카드의 Code Metrics를 클릭하세요.
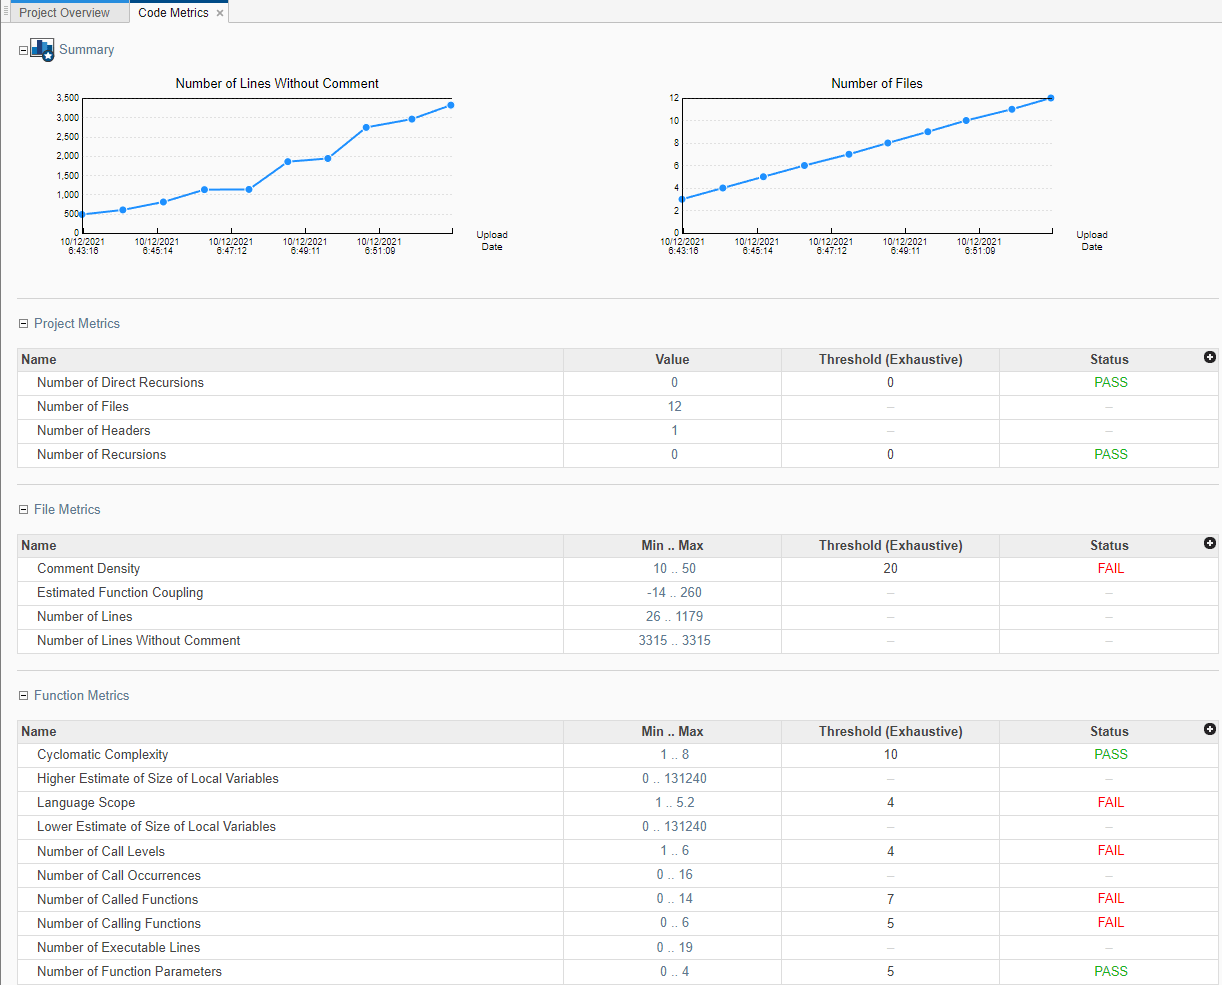
Summary 섹션에서는 해당 프로젝트의 Number of lines Without Comment 및 Number of Files 추세 차트를 볼 수 있습니다.
대시보드의 다른 섹션에는 다양한 프로젝트, 파일 및 기능 메트릭의 계산된 값이나 범위가 포함된 표가 표시됩니다. 해당되는 경우, 표에는 해당 코드 메트릭에 대한 사전 정의된 임계값과 통과/실패 상태가 표시됩니다. 코드 복잡성 측정 임계값 목록은 HIS Code Complexity Metrics (Polyspace Bug Finder)를 참조하세요. Project Explorer에서 폴더를 선택하면 Code Metrics 대시보드의 표에는 임계값이나 통과/실패 상태가 표시되지 않습니다. 메트릭의 값이나 범위는 선택한 폴더의 모든 하위 프로젝트를 집계한 것입니다. 이 집계 보기에서 프로젝트를 자세히 알아보려면 테이블 행을 확장하고 프로젝트 이름을 클릭하세요.
코드 품질을 개선하려면 통과/실패 상태를 사용하여 임계값을 초과하는 메트릭 값을 식별하고 낮춥니다.
예를 들어, Number of Called Functions 범위가 미리 정의된 임계값을 초과하는 경우:
Status 열에서 FAIL를 클릭하거나 Min..Max 열에서 범위를 클릭하여 Number of Called Functions 메트릭으로 필터링된 Results List를 엽니다.
지표 임계값을 초과하는 결과를 검토합니다. 해당 함수 중 여러 개가 항상 함께 호출되는 경우, 해당 함수의 본문을 결합하는 하나의 함수를 작성할 수 있습니다. 함께 호출되는 함수 그룹 대신 해당 함수 하나만 호출하세요.