이 번역 페이지는 최신 내용을 담고 있지 않습니다. 최신 내용을 영문으로 보려면 여기를 클릭하십시오.
단위 원판에서의 푸아송 방정식
이 예제에서는 푸아송 방정식을 수치적으로 풀고, 수치 해를 엄밀해와 비교하고, 해가 비슷해질 때까지 메시를 미세 조정하는 방법을 보여줍니다.
단위 원판에서 디리클레 경계 조건이 0인 푸아송 방정식은 에서 (에서는 )로 작성할 수 있습니다. 여기서 는 단위 원판입니다. 엄밀해는 다음과 같습니다.
대부분의 PDE는 엄밀해가 알려져 있지 않습니다. 그러나 단위 원판에서의 푸아송 방정식은 정확한 엄밀해가 알려져 있으므로, 메시를 미세 조정하면서 오차가 어떻게 감소하는지 확인하는 데 사용할 수 있습니다.
문제 정의
PDE 모델을 만들고 지오메트리를 포함시킵니다.
model = createpde();
geometryFromEdges(model,@circleg);
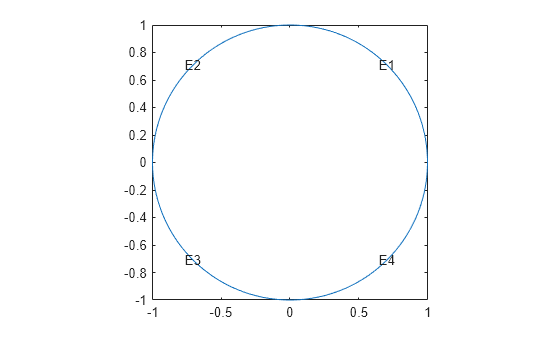
지오메트리를 플로팅하고 경계 조건 정의에 사용할 모서리 레이블을 표시합니다.
figure
pdegplot(model,"EdgeLabels","on");
axis equal
모든 모서리에 0 디리클레 경계 조건을 지정합니다.
applyBoundaryCondition(model,"dirichlet", ...
                             "Edge",1:model.Geometry.NumEdges, ...
                             "u",0);
계수를 지정합니다.
specifyCoefficients(model,"m",0,"d",0,"c",1,"a",0,"f",1);
성긴 메시에서의 해와 오차
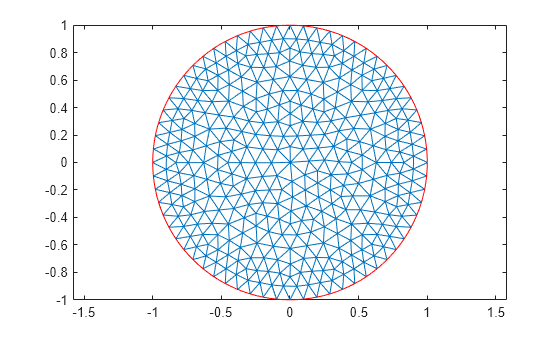
목표 최대 요소 크기를 0.1로 지정하여 메시를 생성합니다.
hmax = 0.1;
generateMesh(model,"Hmax",hmax);
figure
pdemesh(model);
axis equal
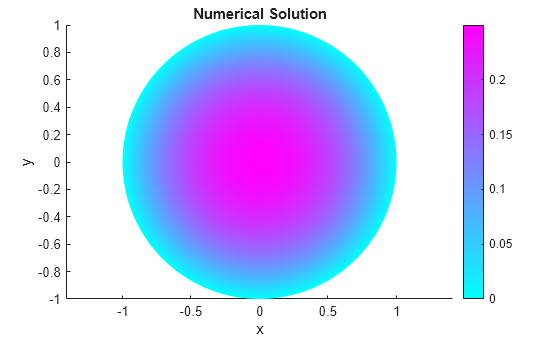
PDE를 풀고 해를 플로팅합니다.
results = solvepde(model);
u = results.NodalSolution;
pdeplot(model,"XYData",u)
title("Numerical Solution");
xlabel("x")
ylabel("y")
axis equal

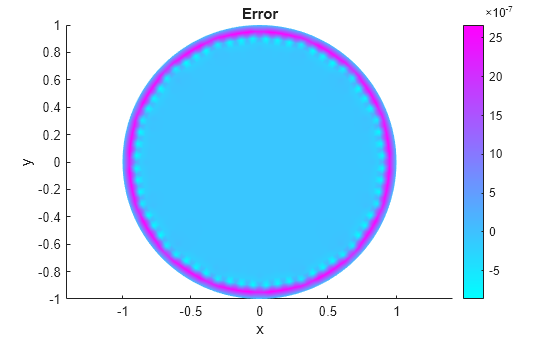
이 결과를 해석적 엄밀해와 비교하고 오차를 플로팅합니다.
p = model.Mesh.Nodes;
exact = (1 - p(1,:).^2 - p(2,:).^2)/4;
pdeplot(model,"XYData",u - exact')
title("Error");
xlabel("x")
ylabel("y")
axis equal
미세 조정된 메시에서의 해 및 오차
각 반복에서 메시를 미세 조정하면서 방정식을 풀고 그 결과를 엄밀해와 비교합니다. 각 미세 조정마다 Hmax 값이 절반으로 줄어듭니다. 오차 벡터의 무한대 노름이 보다 작아질 때까지 메시를 미세 조정합니다.
hmax = 0.1;
error = [];
err = 1;
while err > 5e-7 % run until error <= 5e-7
    generateMesh(model,"Hmax",hmax); % refine mesh
    results = solvepde(model);
    u = results.NodalSolution;
    p = model.Mesh.Nodes;
    exact = (1 - p(1,:).^2 - p(2,:).^2)/4;
    err = norm(u - exact',inf); % compare with exact solution
    error = [error err]; % keep history of err
    hmax = hmax/2;
end
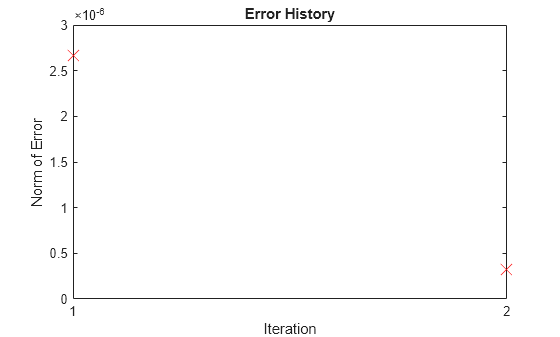
각 반복에서 오차 벡터의 무한대 노름을 플로팅합니다. 반복할 때마다 오차 값이 감소합니다.
plot(error,"rx","MarkerSize",12);
ax = gca;
ax.XTick = 1:numel(error);
title("Error History");
xlabel("Iteration");
ylabel("Norm of Error");
최종 메시와 그에 대응하는 해를 플로팅합니다.
figure
pdemesh(model);
axis equal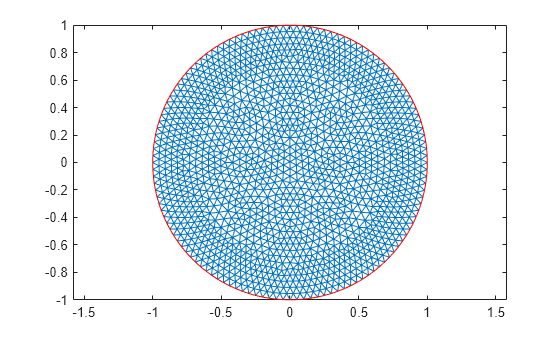
figure
pdeplot(model,"XYData",u)
title("Numerical Solution");
xlabel("x")
ylabel("y")
axis equal
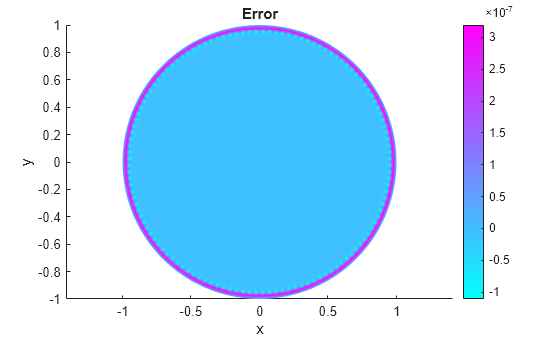
결과를 해석적 엄밀해와 비교하고 오차를 플로팅합니다.
p = model.Mesh.Nodes;
exact = (1 - p(1,:).^2 - p(2,:).^2)/4;
pdeplot(model,"XYData",u - exact')
title("Error");
xlabel("x")
ylabel("y")
axis equal