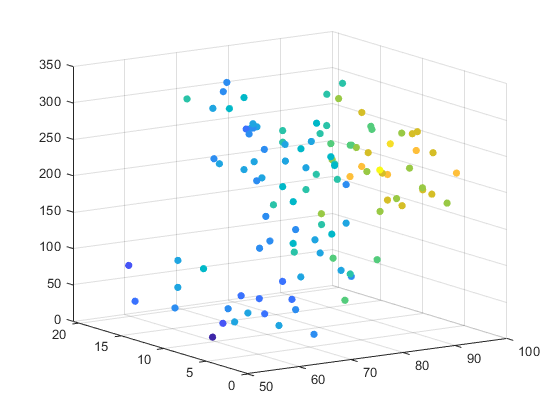
3차원 산점도 플롯 만들기
이 예제에서는 MATLAB에서 3차원 산점도 플롯을 만드는 방법을 보여줍니다. MATLAB 도움말 문서에서 scatter3 함수에 대해 확인할 수 있습니다.
오존 수치에 대한 데이터를 불러옵니다.
load ozoneData Ozone Temperature WindSpeed SolarRadiation
오존 수치를 계산합니다.
z = (Ozone).^(1/3);
response = z;
오존 수치에 대한 색 인덱스를 만듭니다.
nc = 16;
offset = 1;
c = response - min(response);
c = round((nc-1-2*offset)*c/max(c)+1+offset);
scatter3 함수를 사용하여 3차원 산점도 플롯을 만듭니다.
figure
scatter3(Temperature, WindSpeed, SolarRadiation, 30, c, 'filled')
view(-34, 14)

제목과 축 레이블을 추가합니다.
title('Ozone Levels')
xlabel('Temperature')
ylabel('Wind Speed')
zlabel('Solar Radiation')

눈금 레이블이 있는 컬러바를 추가합니다. 줄임표 '...'를 사용하여 명령문을 다음 라인에 이어서 입력합니다.
colorbar('Location', 'EastOutside', 'YTickLabel',...
{'2 ppm', '4 ppm', '6 ppm', '8 ppm', '10 ppm', '12 ppm', '14 ppm'})
