4차원 데이터 시각화
이 예제에서는 MATLAB®에서 4차원 데이터를 시각화하는 여러 가지 기법을 보여줍니다.
하나의 이산 변수(Discrete Variable)를 사용하여 4차원 데이터 시각화
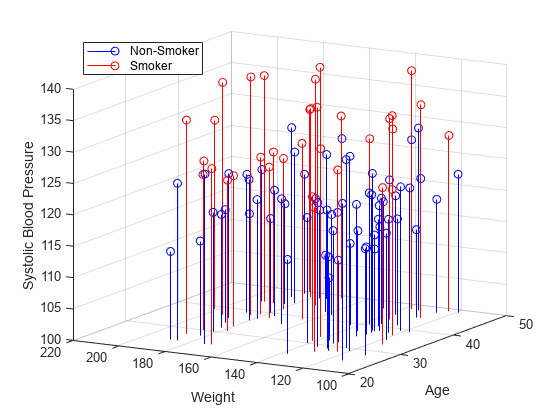
때때로 데이터는 몇 가지 이산 값만을 가질 수 있는 변수로 구성됩니다. 각 이산 그룹의 데이터에 대해 동일한 유형의 플롯을 여러 개 만들 수 있습니다. 예를 들어, stem3 함수를 사용하여 세 개의 변수 사이 관계를 표시할 수 있습니다. 여기서 네 번째 변수는 모집단을 이산 그룹으로 나눕니다.
load patients Smoker Age Weight Systolic                           % load data

nsIdx = Smoker == 0;
smIdx = Smoker == 1;

figure
stem3(Age(nsIdx), Weight(nsIdx), Systolic(nsIdx), 'Color', 'b')    % stem plot for non-smokers
hold on
stem3(Age(smIdx), Weight(smIdx), Systolic(smIdx), 'Color', 'r')    % stem plot for smokers
hold off

view(-60,15)
zlim([100 140])

xlabel('Age')                                                      % add labels and a legend
ylabel('Weight')
zlabel('Systolic Blood Pressure')
legend('Non-Smoker', 'Smoker', 'Location', 'NorthWest')
여러 개의 플롯을 사용하여 4차원 데이터 시각화
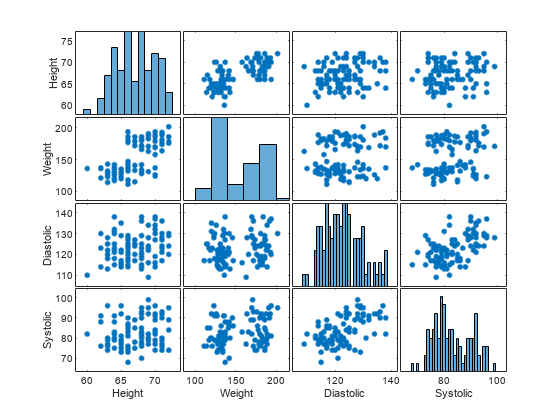
대규모 데이터 세트에서 각 변수가 상관 관계가 있는지 보려 할 수 있습니다. 이 경우 plotmatrix 함수를 사용하여 플롯의 nxn 행렬을 만들어 변수들의 관계를 변수 두 개씩의 관계로 표시할 수 있습니다. plotmatrix 함수는 두 개의 출력값을 반환합니다. 첫 번째 출력값은 산점도 플롯에 사용된 line 객체로 구성된 행렬입니다. 두 번째 출력값은 생성된 axes 객체로 구성된 행렬입니다.
더 높은 차원의 데이터 세트에 대해서도 plotmatrix 함수를 사용할 수 있습니다.
load patients Height Weight Diastolic Systolic    % load data

labels = {'Height' 'Weight' 'Diastolic' 'Systolic'};
data = [Height Weight Systolic Diastolic];

[h,ax] = plotmatrix(data);                        % create a 4 x 4 matrix of plots
for i = 1:4                                       % label the plots
  xlabel(ax(4,i), labels{i})
  ylabel(ax(i,1), labels{i})
end
세 개의 변수로 구성된 함수 시각화
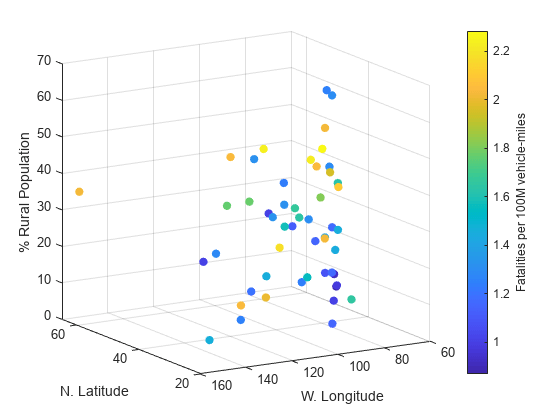
여러 종류의 4차원 데이터에 대해 색을 사용하여 네 번째 차원을 나타낼 수 있습니다. 세 개의 변수로 구성된 함수를 사용하는 경우 이 방법은 상당히 효과적입니다.
예를 들어, 미국 내 고속도로 사망 사고 건수를 경도, 위도, 사고 위치가 지방인지 도시인지 여부의 함수로 나타낼 수 있습니다. 플롯의 x, y, z 값은 이 세 가지 변수를 나타냅니다. 색은 고속도로 사망 사고 건수를 나타냅니다.
cla
load accidents hwydata                             % load data

long = -hwydata(:,2);                              % longitude data
lat = hwydata(:,3);                                % latitude data
rural = 100 - hwydata(:,17);                       % percent rural data
fatalities = hwydata(:,11);                        % fatalities data

scatter3(long,lat,rural,40,fatalities,'filled')    % draw the scatter plot
ax = gca;
ax.XDir = 'reverse';
view(-31,14)
xlabel('W. Longitude')
ylabel('N. Latitude')
zlabel('% Rural Population')

cb = colorbar;                                     % create and label the colorbar
cb.Label.String = 'Fatalities per 100M vehicle-miles';
볼륨에 데이터 시각화
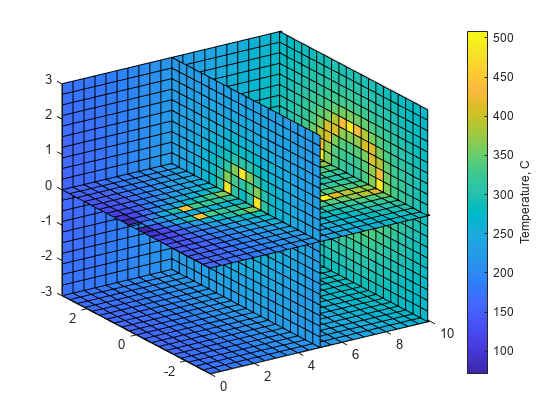
데이터에 배관의 온도 같이 물체에 대해 측정된 값이 포함될 수도 있습니다. 이 경우 측정값의 크기를 볼륨에 컬러로 나타내 물리적 크기를 표현할 수 있습니다. 예를 들어, 측정된 변수의 값을 slice 함수를 사용하여 볼륨 내 단면에 표시할 수 있습니다.
load fluidtemp x y z temp                       % load data

xslice = [5 9.9];                               % define the cross sections to view
yslice = 3;
zslice = ([-3 0]);

slice(x, y, z, temp, xslice, yslice, zslice)    % display the slices
ylim([-3 3])
view(-34,24)

cb = colorbar;                                  % create and label the colorbar
cb.Label.String = 'Temperature, C';
복소 변수(Complex Variable) 함수 플로팅
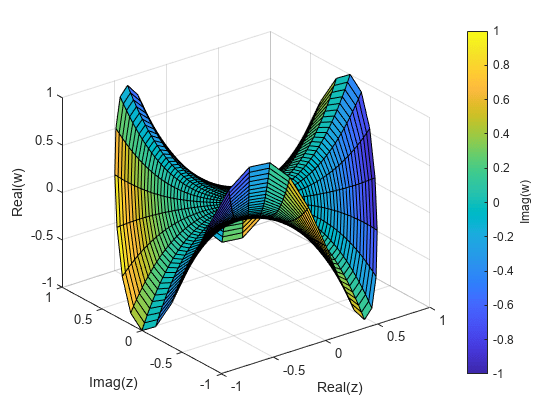
복소 함수는 실수부와 허수부가 있는 입력값과 실수부와 허수부가 있는 출력값을 가집니다 컬러로 된 3차원 플롯을 사용하여 복소 함수를 나타낼 수 있습니다. 이 경우 x축과 y축은 입력값의 실수부와 허수부를 나타냅니다. z축은 출력값의 실수부를 나타내고 컬러는 출력값의 허수부를 나타냅니다.
r = (0:0.025:1)';                        % create a matrix of complex inputs
theta = pi*(-1:0.05:1);
z = r*exp(1i*theta);
w = z.^3;                                % calculate the complex outputs

surf(real(z),imag(z),real(w),imag(w))    % visualize the complex function using surf
xlabel('Real(z)')
ylabel('Imag(z)')
zlabel('Real(w)')
cb = colorbar;
cb.Label.String = 'Imag(w)';
