그래프 제목을 작게 줄이는 방법
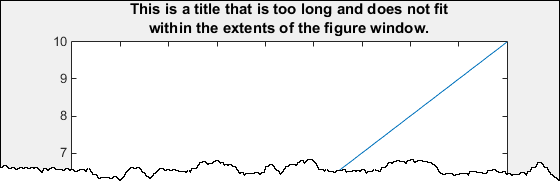
더욱 향상된 가시성을 위해 MATLAB® 그래픽스 제목에 굵은 글꼴과 좀 더 커진 글꼴이 사용됩니다. 결과적으로, 긴 제목은 Figure 창 범위 내에 맞지 않을 수 있습니다. 예를 들어, 다음 코드는 Figure 창 범위 내에 맞지 않는 긴 제목을 가지는 플롯을 생성합니다.
plot(1:10);
title(['This is a title that is too long and does not fit', ...
    'within the extents of the figure window.'])
제목 글꼴 크기는 좌표축의 TitleFontSizeMultiplier 속성과 FontSize 속성에 따라 결정됩니다. 기본적으로 FontSize 속성은 10포인트이고 TitleFontSizeMultiplier는 1.100입니다. 즉, 제목 글꼴 크기가 11포인트라는 의미입니다.
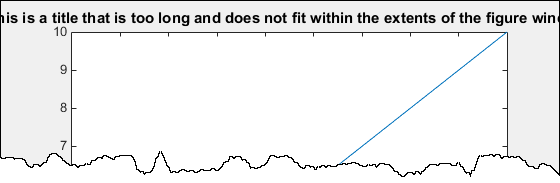
좌표축의 다른 텍스트에는 영향을 미치지 않고 제목 글꼴 크기만 변경하려면 좌표축의 TitleFontSizeMultiplier 속성을 설정하십시오. 예를 들어, 좌표축의 다른 텍스트와 일치하도록 제목 글꼴 크기를 변경합니다.
plot(1:10);
title(['This is a title that is too long and does not fit', ...
    'within the extents of the figure window.'])
ax = gca;
ax.TitleFontSizeMultiplier = 1;

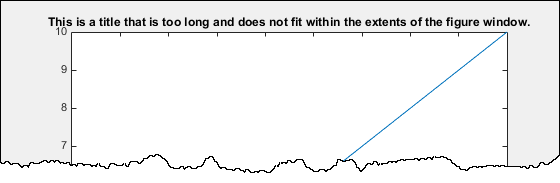
전체 좌표축에 대해 글꼴 크기를 줄이려면 FontSize 속성을 설정하십시오. 이 속성을 변경하면 제목의 글꼴, 눈금 레이블 및 축 레이블에 (존재하는 경우) 각각 변경 내용이 적용됩니다.
plot(1:10);
title(['This is a title that is too long and does not fit', ...
    'within the extents of the figure window.'])
ax = gca;
ax.FontSize = 8;
제목을 두 줄에 걸쳐 표시하려면 중괄호 {}로 묶은 셀형 배열을 사용하여 여러 줄로 된 제목을 정의합니다.
plot(1:10);
title({'This is a title that is too long and does not fit', ...
    'within the extents of the figure window.'})