Read Quantitative Data from WMS Server
WMS servers typically provide layers as images instead of as quantitative data. In some rare cases, you can get quantitative data from specific WMS servers by requesting data in the GeoTIFF or BIL format.
You can determine the formats that a server supports by querying the
ImageFormats field of the structure contained within the
Details property of a WMS
layer.
layers = wmsfind("mathworks","SearchField","serverurl");
elevation = refine(layers,"elevation");
elevation = wmsupdate(elevation);
elevation.Details.ImageFormats
These examples show how to read terrain elevation data from the WMS server hosted by MathWorks® and then display the data as a surface or a texture-mapped surface.
Read and Display Terrain Elevation Data
Search the WMS Database for a layer containing terrain elevation data from the WMS server hosted by MathWorks.
layers = wmsfind("mathworks",SearchField="serverurl");
elevation = refine(layers,"elevation");
Read the terrain elevation data from the server for a region surrounding the Gulf of Maine. Specify the sampling interval as 30 arc-seconds and the image format as BIL.
GT = geocode("Gulf of Maine","physical",FilterResults="first");
[latlim,lonlim] = bounds(GT.Shape);

samplingInterval = dms2degrees([0 0 30]);
imageFormat = "image/bil";

[Z,R] = wmsread(elevation,Latlim=latlim,Lonlim=lonlim, ...
    ImageFormat=imageFormat,CellSize=samplingInterval);
Note that Z is an array containing terrain elevation data rather than an RGB image. Find the minimum and maximum elevation.
elevationLimits = [min(min(Z)) max(max(Z))]
elevationLimits = 1×2 int16 row vector

      -7    1181
Prepare the data for plotting by converting the data type to double. To make the water areas appear blue on the plot, set elevations at sea level (Z == 0) to a value below sea level.
Z = double(Z);
Z(Z == 0) = -1;
Display the terrain elevation data on a map and plot contour lines at sea level.
figure
worldmap(Z,R)
geoshow(Z,R,DisplayType="texturemap")
contourm(Z,R,[0 0],Color="k")
Customize the map by adding a title and subtitle, a colormap appropriate for elevation data, and a labeled color bar.
title("Gulf of Maine")
st = textwrap(string(elevation.LayerTitle),40);
subtitle(st)
demcmap(Z)

c = colorbar;
c.Label.String = "Elevation (meters)";

Merge Elevation Data with Rasterized Vector Data
Read terrain elevation data and rasterized national boundaries for a region. Then, embed the boundaries into the elevation data and display the result on a map.
Read Terrain Elevation Data
Search the WMS Database for a layer containing terrain elevation data from the WMS server hosted by MathWorks.
layers = wmsfind("mathworks",SearchField="serverurl");
elevation = refine(layers,"elevation");
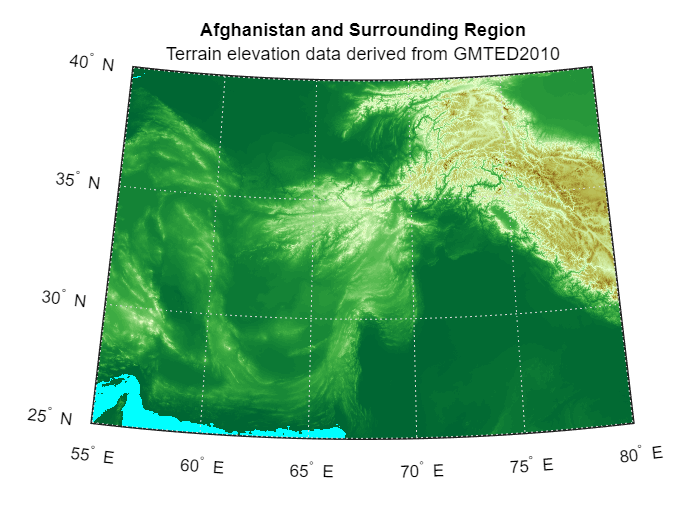
Read the terrain elevation data from the server for a region surrounding Afghanistan. Specify the sampling interval as 1 minute and the image format as BIL.
latlim = [25 40];
lonlim = [55 80];
samplingInterval = dms2degrees([0 1 0]);
[ZA,R] = wmsread(elevation,Latlim=latlim,Lonlim=lonlim, ...
   CellSize=samplingInterval,ImageFormat="image/bil");
Note that ZA is an array of elevation data rather than an RGB image. Find the minimum and maximum elevations.
elevationLimits = [min(min(ZA)) max(max(ZA))]
elevationLimits = 1×2 int16 row vector

     -13    7350
Display Terrain Elevation Data
Prepare the data for plotting by converting the data type to double. To make the water areas appear blue on the plot, set elevations at sea level (ZA == 0) to a value below sea level.
ZA = double(ZA);
ZA(ZA == 0) = -1;
Display the elevation data as a texture map.
figure
worldmap("Afghanistan")
geoshow(ZA,R,DisplayType="texturemap")
demcmap(ZA)
title("Afghanistan and Surrounding Region")
subtitle(elevation.LayerTitle)
Read Rasterized Vector Data
Get a layer containing boundaries data from the EOC Basemap Map Service server.
info = wmsinfo("https://geoservice.dlr.de/eoc/basemap/wms?");
layers = info.Layer;
boundaries = refine(layers,"ne_countries");
Read the boundaries as an RGB image. Dark values in the image represent the boundaries.
B = wmsread(boundaries,Latlim=latlim,Lonlim=lonlim,CellSize=samplingInterval);
Merge Elevation and Rasterized Vector Data
To embed the boundaries into the elevation data, find the elements of the boundaries image that contain dark values. Then, replace the corresponding elements of the elevation array with a value slightly higher than the maximum elevation.
ZB = ZA;
idx = B(:,:,1) < 250;
ZB(idx) = max(ZA(:)) + 1;
Display Merged Data
Display the updated data on a new map.
figure
worldmap("Afghanistan")
geoshow(ZB,R,DisplayType="texturemap")
title("Afghanistan and Country Boundaries")
subtitle(elevation.LayerTitle)
Apply a colormap appropriate for elevation data. Use black for the boundaries.
cmap = demcmap(ZB);
cmap(end,:,:) = [0 0 0];
colormap(cmap)

Drape Basemap Imagery onto Elevation Data
Read basemap imagery and terrain elevation data for a region. Then, create a 3-D map display by draping the basemap imagery over the elevation data.
Read Basemap Imagery
Specify the latitude and longitude limits for a region around the Grand Canyon. Read an image for the region from the "satellite" basemap as an array and as a map cells reference object in Web Mercator coordinates.
latlim = [36 36.23];
lonlim = [-113.36 -113.13];
[A,R,attrib] = readBasemapImage("satellite",latlim,lonlim);
Read Terrain Elevation Data
WMS servers typically provide data referenced to the World Geodetic System of 1984 (WGS84). If a layer provides data referenced to a different coordinate system, then you can specify the coordinate system by using a web map server object, a WMS map request object, and the getMap function.
Create a web map server object that communicates with the WMS server provided by MathWorks. Get the terrain elevation layer from the capabilities document.
serverURL = "https://wms.mathworks.com";
server = WebMapServer(serverURL);
info = getCapabilities(server);
elevation = refine(info.Layer,"elevation");
Verify the server provides data referenced to Web Mercator coordinates. The Web Mercator coordinate system has the EPSG code 3857.
elevation.CoordRefSysCodes
ans = 2×1 cell
    {'EPSG:3857'}
    {'EPSG:4326'}
Create a map request object for the layer.
Specify the coordinate system as Web Mercator.
Specify the image dimensions and world xy-limits so that they match the basemap image.
Request quantitative elevation data by specifying the image format as BIL.
mapRequest = WMSMapRequest(elevation);
mapRequest.CoordRefSysCode = "EPSG:3857";
mapRequest.ImageHeight = size(A,1);
mapRequest.ImageWidth = size(A,2);
mapRequest.XLim = R.XWorldLimits;
mapRequest.YLim = R.YWorldLimits;
mapRequest.ImageFormat = "image/bil";
Read the elevation data by using the getMap function.
Z = getMap(server,mapRequest.RequestURL);
Z = double(Z);
Display Imagery and Elevation Data
Drape the image over the elevation data.
figure
mapshow(Z,R,"DisplayType","surface","CData",A)
bmapAttrib = "Basemap from " + attrib;
wmsAttrib = string(elevation.LayerTitle);
title("Grand Canyon")
subtitle(bmapAttrib + ", " + wmsAttrib,"FontSize",8)
axis off

Adjust the camera view.
campos([-12400000 4240000 152000])
camva(5.4)

Tips
To request quantitative data, you must generally create either a Web Coverage Service (WCS) request or a Web Feature Service (WFS) request. Mapping Toolbox™ does not support WCS or WFS requests.
Although BIL files can contain multiple co-registered bands (channels), the BIL files returned by WMS servers include only a single band.
The
wmsreadfunction interpolates the elevation data from the WMS server hosted by MathWorks based on the specified latitude and longitude limits. As a result, the data associated with a geographic location varies slightly depending on the limits used to read the data.The elevation data from the WMS server hosted by MathWorks does not contain bathymetry data.
The elevation data from the WMS server hosted by MathWorks does not contain data for a small region within Lake Superior.
Map request URLs from the WMS server hosted by MathWorks are not supported by web browsers or by the
webreadfunction.