Machine-Learning-Based Identification of Nonlinear Magneto-Rheological Fluid Damper
This example shows how to estimate a black-box dynamic model of a nonlinear magneto-rheological (MR) fluid damper. Magneto-rheological dampers are used to reduce structural vibrations by applying a controlled force, which depends on the input voltage and current of the device. A nonlinear ARX model with a regression tree ensemble mapping function is used to model the MR damper.
Regression tree ensemble models are nonparametric models that are structured as a weighted combination of multiple regression trees. Each regression tree consists of decision nodes and leaf nodes. A decision node represents a value for an attribute (feature) being tested. A leaf node represents a numerical value associated with the decision [1]. Regression models are estimated recursively by splitting the data set into progressively smaller components. Combining multiple regression trees improves the predictive performance of regression tree ensemble models.
The data used in this example was provided by Dr. Akira Sano (Keio University, Japan) and Dr. Jiandong Wang (Peking University, China) who performed the experiments in a laboratory of Keio University. For a more detailed description of the experimental system and some related studies see [2].
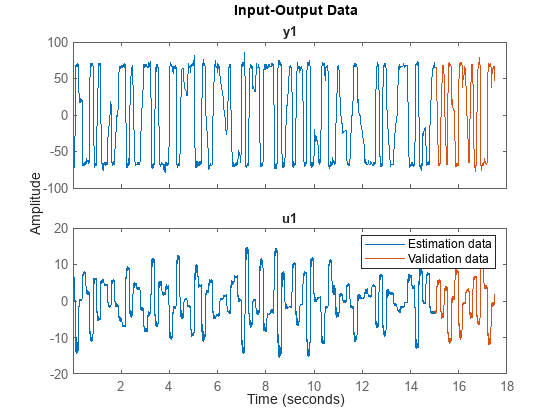
In the experiment, one end of an MR damper fixed to the ground. The other end is connected to a shaker table that generates vibrations. The data set contains 3,499 input-output samples. The input is the velocity of the damper measured in cm/sec and the output is the damping force measured in Newtons. Load the experimental data.
load('mrdamper.mat')Construct an iddata object from and .
data = iddata(F,V,Ts);
Split the data into estimation data and validation data. To estimate a nonlinear ARX model with a regression tree ensemble mapping function, use the first 3,000 samples of the input-output data. Use the last 499 samples for validation.
% Estimation data
ze = data(1:3000);
% Validation data
zv = data(3001:end);
Plot the estimation and validation data.
plot(ze)
hold on
plot(zv)
hold off
legend("Estimation data","Validation data")
Estimate Model
Estimate a nonlinear ARX model using the tree ensemble nonlinearity. Set the nonlinear ARX model orders to [16 16 0]. Doing so configures the model to use 16 input regressors, 16 output regressors, and no input-output delays.
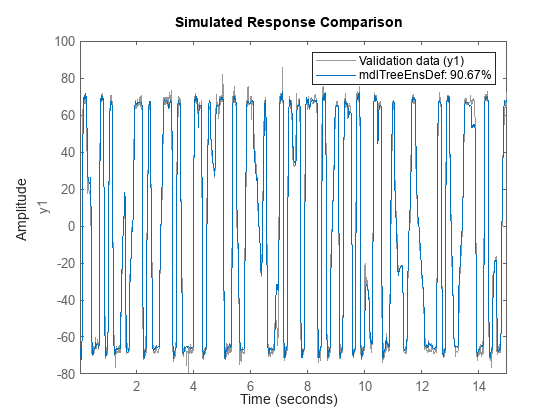
mdlTreeEnsDef = nlarx(ze,[16 16 0],idTreeEnsemble);
Plot the simulated response of the estimated model along with the estimation data.
compare(ze,mdlTreeEnsDef)
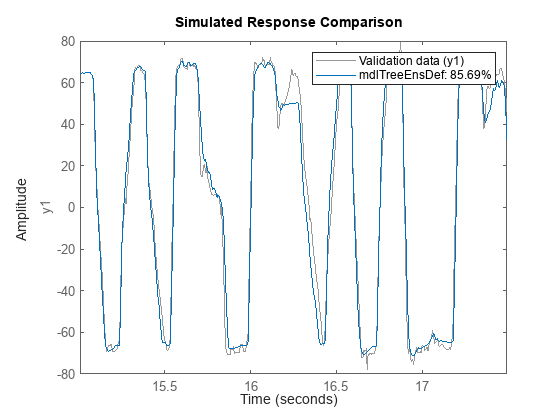
Plot the simulated response of the estimated model along with the validation data.
compare(zv,mdlTreeEnsDef)
Explore Estimation Options
Use nondefault values for the estimation options. For this example, set the fit method to 'lsboost-resampled'. Estimate a model and plot its simulated response.
ens = idTreeEnsemble;
ens.EstimationOptions.FitMethod = 'lsboost-reweighted';
ens.EstimationOptions.NumLearningCycles = 150;
mdlTreeEnsBoostReweight = nlarx(ze,[16 16 0],ens);
compare(zv,mdlTreeEnsBoostReweight)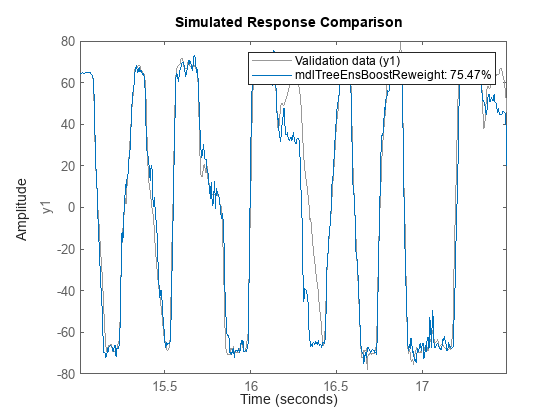
Reduce the estimation time and obtain and compact regression ensemble model by using the Shrink estimation option.
ens = idTreeEnsemble;
ens.EstimationOptions.Shrink = 'on';
mdlTreeEnsDefShrink = nlarx(ze,[16 16 0],ens);
compare(ze,mdlTreeEnsDefShrink)
compare(zv,mdlTreeEnsDefShrink)

Compare Estimated Models with Other Nonlinearities
Use the training data to estimate nonlinear ARX models using wavelet network and sigmoid network nonlinearities.
mdlWaveletNet = nlarx(ze,[16 16 0],idWaveletNetwork);
mdlSigmoidNet = nlarx(ze,[16 16 0],idSigmoidNetwork);
Compare the identified nonlinear ARX models obtained in this example using the validation data.
compare(zv,mdlTreeEnsDef,mdlTreeEnsBoostReweight,...
    mdlTreeEnsDefShrink,mdlWaveletNet,mdlSigmoidNet)
References
[1] Breiman, Leo, ed. Classification and Regression Trees. CRC Press repr. Boca Raton, Fla.: Chapman & Hall/CRC, 1984.
[2] Wang, Jiandong, Akira Sano, Tongwen Chen, and Biao Huang. ‘Identification of Hammerstein Systems without Explicit Parameterisation of Non-Linearity’. International Journal of Control 82, no. 5 (May 2009): 937–52. https://doi.org/10.1080/00207170802382376.