How to Collect Design Cost Metrics
Learn how to programmatically assess the cost of implementing your design in embedded C code. Design cost metrics analyze your model and report detailed cost data that can be traced back to the blocks in the Simulink® model. You can use design cost metrics to:
Estimate the program size based on a count of operators in the generated code.
Estimate the total size, in bytes, of all global variables and static local variables used during code generation.
Design cost metrics analyze one or more design units in a project, where a design unit represents a standalone Simulink model, or an entire model reference hierarchy. After collecting metrics, you can programmatically access high-level results or generate a report for detailed cost breakdown information. By running a script that collects these metrics, you can automatically analyze the cost of your design to, for example, assess the impact of different design alternatives before deploying to hardware.
Open Project
To open the project that includes the models, in the MATLAB® Command Window, enter this command.
openExample('simulink/VisualizeModelReferenceHierarchiesExample')Note
To collect design cost metrics, all design files must be in a project. Your design
must also be ready for code generation, including all models contained in a model
reference hierarchy. Models that are not code generation ready will be ignored during
metric execution and produce an error. You can use the getArtifactErrors function to see errors that occur during metric
execution.
Collect Metric Results
Create a metric.Engine
object.
metric_engine = metric.Engine();
metric.Engine object represents the metric engine that you can
execute with the execute object function to collect metric data on your design.If models in your project have changed, update the trace information for
metric_engine to reflect any pending artifact
changes.
updateArtifacts(metric_engine)
Create an array of metric identifiers for the metrics you want to collect. For this example, create a list of the metric identifiers used for design cost estimation.
metric_Ids = {'OperatorCount','DataSegmentEstimate'}You can use the getAvailableMetricIds function to create a full list of all available metric
identifiers. For a list of design cost metrics and their identifiers, see Design Cost Model Metrics. For additional model
testing metrics, see Model Testing Metrics (Simulink Check).
Collect Results for One Design Unit
You can collect metric results for one design unit in the project, where a design unit represents a standalone Simulink or the top-level model of a model reference hierarchy. When you collect and view results for a design unit, the metrics return data only for the artifacts that trace to the specified design unit.
Collect the metric results for the sldemo_mdlref_depgraph
model.
Create an array that identifies the path to the model file in the project and the name of the model.
unit = {fullfile(pwd,'sldemo_mdlref_depgraph.slx'),'sldemo_mdlref_depgraph'};Execute the engine. Use 'ArtifactScope' to specify the unit for
which you want to collect results. The engine runs the metrics for only the artifacts that
trace to the model that you specify. Collecting results for the design cost metrics
requires a Fixed-Point Designer™
license.
execute(metric_engine,metric_Ids,'ArtifactScope',unit)This project contains artifact traceability issues. You can use the getArtifactIssues function to investigate further.
Collect Results for Each Design Unit in Project
To collect the results for each design unit in the project, execute the engine without
the argument for
ArtifactScope.
execute(metric_engine,metric_Ids)
sldemo_mdlref_depgraph, which is the top-level model
in a model reference hierarchy. This model reference hierarchy represents one design
unit.Access High-Level Results Programmatically
To access the results programmatically, use the getMetrics function.
The function returns the metric.Result objects that contain the result
data for the specified unit and metrics. For this example, store the results for the
OperatorCount and DataSegmentEstimate metrics in
corresponding
arrays.
results_OperatorCount = getMetrics(metric_engine,'OperatorCount');
results_DataSegmentEstimate = getMetrics(metric_engine,'DataSegmentEstimate');
The OperatorCount metric returns a unitless estimate of the program
size based on operator count. Use the disp function to display the
total cost of the
design.
disp(['Unit:  ', results_OperatorCount.Artifacts.Name])
disp(['Total Cost:  ', num2str(results_OperatorCount.Value)])
Unit:  sldemo_mdlref_depgraph
Total Cost:  57
This result shows that for sldemo_mdlref_depgraph, the total cost of
the design is 57. This is a unitless value based on a count of operators in the generated
code, and is an abstraction of the total program size.
The metric DataSegmentEstimate returns the estimated size of the data
segment of the program. This value represents the total size, in bytes, of all global
variables and static local variables used during code generation. Use the disp
function to display the total data segment size.
disp(['Unit:  ', results_DataSegmentEstimate.Artifacts.Name])
disp(['Data Segment Size (bytes):  ', num2str(results_DataSegmentEstimate.Value)])
Unit:  sldemo_mdlref_depgraph
Data Segment Size (bytes):  228
This result shows that for sldemo_mdlref_depgraph, the total data
segment size estimate is 228 bytes.
Generate Report to Access Detailed Results
Generate a report that contains a detailed breakdown of design cost metric results. For
this example, specify the HTML file format, use pwd to
provide the path to the current folder. Name the report
'MetricResultsReport.html'.
reportLocation = fullfile(pwd,'MetricResultsReport.html');
generateReport(metric_engine,'App','DesignCostEstimation',...
    'Type','html-file','Location',reportLocation);
Note
Report generation requires that the metric collection be executed in the current
session. To recollect design cost metrics, first use the deleteMetrics function to delete the metric.Result. Then, use the execute
function to collect metrics.
Open the HTML report. The report is in the current folder, at the root of the project.
web("MetricResultsReport.html")To open the table of contents and navigate to results for each unit, click the menu icon in the top-left corner of the report. The report contains sections for each metric collected.
Operator Count
The Operator Count section of the report contains information on the cost of the design.
The High Level Statistics section gives the total cost of the design and a breakdown of the
top five most expensive blocks in the sldemo_mdlref_depgraph model
reference hierarchy.
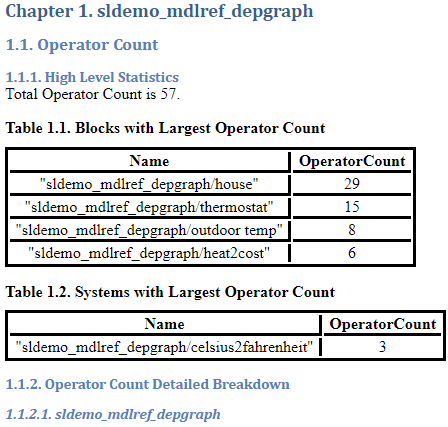
The Operator Count Detailed Breakdown section contains an image of each system, along with a table containing the cost for all blocks within each system.

For each block within the system, the Operator Count by Block Table displays SelfOperatorCount and TotalOperatorCount. For most blocks these cost metrics will be the same. However, for some blocks, the difference between SelfOperatorCount and TotalOperatorCount can highlight important results in the design. For example, if a subsystem contains two Lookup Table blocks with similar configuration, the blocks may share some utilities in common. For example, the TotalOperatorCount of one Lookup Table block might equal to the SelfOperatorCount plus the cost of any shared utilities. For another example, a Subsystem block has a SelfOperatorCount of zero, and the TotalOperatorCount is equal to the cost of everything contained within the subsystem.
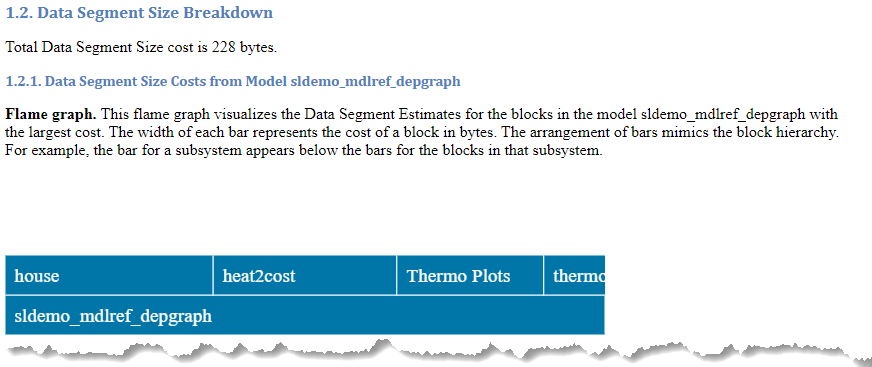
Data Segment Size Breakdown
The Data Segment Size Breakdown section of the report provides the total data segment size cost. A flame graph visualization allows you to identify modeling elements that have a high data segment size cost.
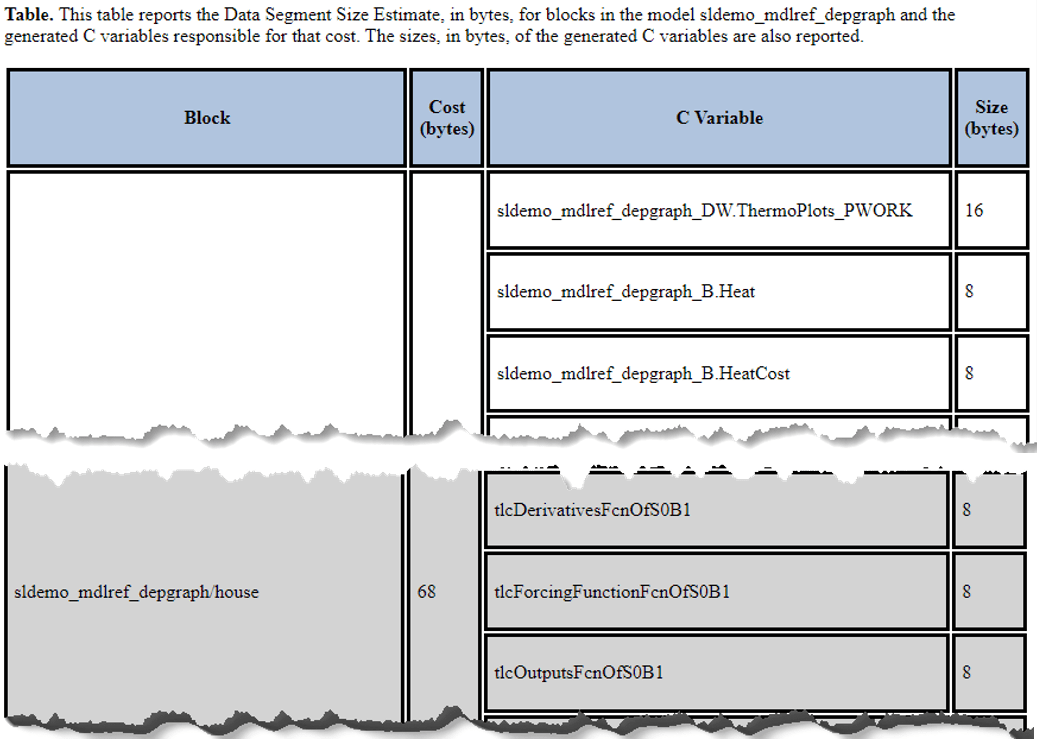
The Data Segment Size Estimate table displays the following information:
Block — Block in the model for which metrics were computed.
Cost (bytes) — Total data segment size cost, in bytes, for each block. The table is sorted to display the highest cost blocks first.
C Variable — The C variables in generated code from each block. The size of C variables for a block sum to the total cost of the block.
Size (bytes) — The data segment size cost, in bytes, of each C variable in the generated code.
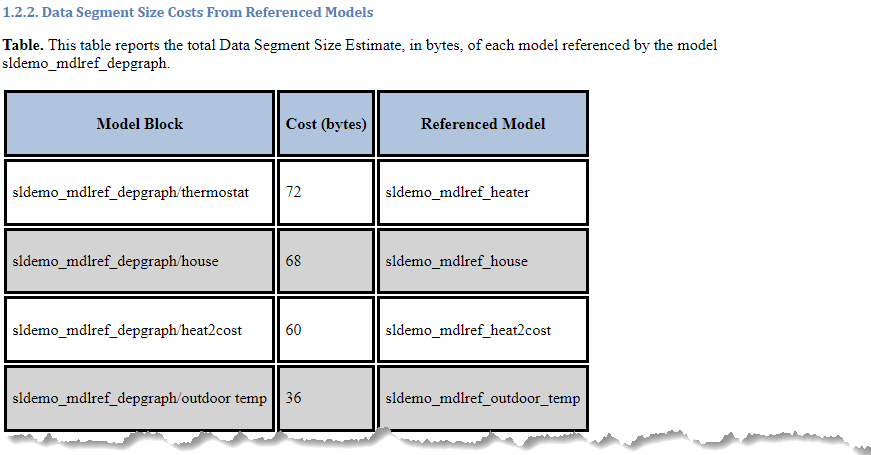
If your model contains referenced models, a second table reports the total Data Segment Size Estimate, in bytes, of each referenced model.
See Also
Design Cost Model Metrics | Model Testing Metrics (Simulink Check) | metric.Engine | execute | generateReport | getAvailableMetricIds | updateArtifacts