Interactively Trace Between MATLAB Code and Generated C/C++ Code
This example shows how to trace between MATLAB® source code and the generated C/C++ code. Tracing between source code and generated code helps you to:
Understand how the code generator implemented your algorithm.
Debug issues in the generated code.
Evaluate the quality of the generated code.
If you have Embedded Coder® and enable production of a code generation report with traceability, you can view MATLAB source code and generated C/C++ code next to each other. As you move your pointer over code, you can follow highlighted traces to the corresponding generated code or source MATLAB code.
Create the MATLAB Source Code
To illustrate interactive traceability, this example produces a
report for generation of a C static library for a MATLAB function lpsolve that solves the linear program:
maximize y = c*x
subject to A*x <= b
where x >= 0 and b >= 0
The example also uses a test function lpsolve_test that calls
lpsolve with representative input values.
In a writable folder, create the files lpsolve.m and
lpsolve_test.m by copying the code from the expanders in this
section.
Prepare for Code Generation
Before you generate C/C++ code, it is a best practice to screen your MATLAB code for code generation readiness.
coder.screener('lpsolve')The code generation readiness report indicates that lpsolve
is suitable for code generation.
It is also a best practice to check for run-time issues by generating and testing a MEX function.
To specify the types of the inputs arguments, pass representative input values to the
codegen-argsoption. Alternatively, because you have a test function, you can usecoder.getArgTypesto determine the types.To generate and test a MEX function, use the
-testoption.
c = [2 3 1 1];
A = [2 3 1 -1;1 0 2 1;0 2 1 1];
b = [27;9;18];
codegen lpsolve -args {c A b} -test lpsolve_test
Running test file: 'lpsolve_test' with MEX function 'lpsolve_mex'.

x =

     5
     7
     0
     4


y =

    35
codegen successfully
generates and runs the MEX function.
Produce a Code Generation Report with Traceability
To generate a report that has interactive traceability:
Create a
coder.EmbeddedCodeConfigobject. TheEnableTraceabilityproperty controls traceability. By default, theEnableTraceabilityproperty istrue.Specify the types of the input arguments by passing representative input values to the
-argsoption.Enable production of a code generation report by using the
-reportoption.
cfg = coder.config('lib', 'ecoder', true);
codegen -config cfg lpsolve -args {c A b} -report
Access Trace Mode in the Report
To open the code generation report, click View report.
In the code pane, you see lpsolve.m.
To enable tracing, on the Report tab, click Trace Code.

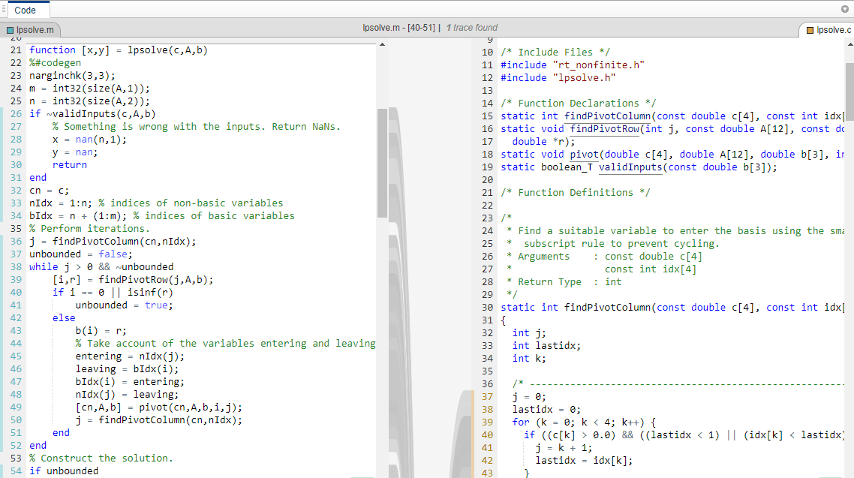
You see the MATLAB source code and the generated C code next to each other.

Trace Code
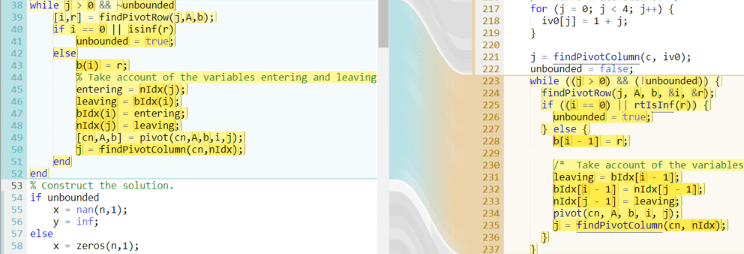
You can trace from the MATLAB code to the C code or from the C code to the MATLAB code. Traceable code is marked with blue on the side that you are tracing from and with orange on the side that you are tracing to. As you move your pointer over traceable code, the code is highlighted in purple and you see the traces to the corresponding code on the other side. When you select highlighted code by clicking it, the code becomes yellow and you can see the traces even when you move your pointer away from the selection. The code remains selected until you press Esc or select different code. To change the side that you are tracing from, select code on the other side.
Explore tracing in the example report.
In the MATLAB code, point to the
while-loop that starts at line 38 and scroll down until the entirewhile-loop is in view.
You see this symbol that tells you that the highlighted MATLAB code has one trace that is not in view.

You see the corresponding C code in a separate window in the C code pane.
In the C code pane, scroll down until you see the C code that corresponds to the
whileloop.
In the MATLAB code, move your pointer over different syntax elements in the
whileloop. Highlight variables, expressions, and code blocks.When you move your pointer over expressions that are part of larger expressions, different shades of purple help you to find the relevant expression in the corresponding C code. For example, at line 43, pause over
i.
In the MATLAB code, move your pointer back to the
while-loop that starts at line 38. When the entire loop is highlighted in purple, select it by clicking. When you move your pointer outside of the trace, the yellow highlighting identifies the selected trace.
To clear the selection, press Esc or select different code.
View Multiple Traces
When code traces to more than one place in the corresponding source or generated code:
If you pause over the code that you are tracing, at the top of the code pane, you see the number of traces.
If some traces are not in view, you see a symbol that tells you how many traces are out of view.

In the code pane, if you select the code that you want to trace, at the top of the code pane, you can select the trace that you want to see.
In the report for lpsolve, view multiple traces.
Pause over line
36.At the top of the code pane, you see that line
36has two traces.Select line
36.At the top of the code pane, you see the location of the first trace.
To list all traces, click the arrow to the right of the traces.

View Traces to Different Files
In the code generation report for lpsolve,
all traces from the MATLAB code go to one C file lpsolve.c. If MATLAB code traces to multiple C files, above the C code, you see a symbol such
as ![]() that provides the number of additional files in which
you can find a trace. If you click the symbol, you can select the file that you want to
see. If you select the MATLAB code, then you can select the trace that you want to see.
that provides the number of additional files in which
you can find a trace. If you click the symbol, you can select the file that you want to
see. If you select the MATLAB code, then you can select the trace that you want to see.

Likewise, above the MATLAB source code, a symbol such as ![]() indicates that the highlighted C code traces to
multiple MATLAB files.
indicates that the highlighted C code traces to
multiple MATLAB files.
Switch the Locations of the Source and Generated Code
To view
lpsolve.con the left side of the code pane, in the list of generated files, clicklpsolve.c.To view the MATLAB code on the left side of the code pane, click a MATLAB function, for example,
lpsolve.
Enable Code Tooltips and Links
When you are not in trace mode:
In the MATLAB code, if you point to a variable or expression, a tooltip provides information such as the type.
In the C code, links go to other parts of the code such as type or function definitions.
When you are in trace mode, to enable MATLAB code tooltips and C code links, hold down Ctrl. MATLAB code tooltips are available only for a selected MATLAB function.
In the report for lpsolve, view type information for a variable.
In the MATLAB Source pane, select
pivot.In the code pane, hold down Ctrl and pause over the input argument
i.
Note
On a Macintosh platform, use the Command key instead of Ctrl.
Disable Traceability
To produce a code generation report that does not include traceability:
In a
coder.EmbeddedCodeConfigobject, set theEnableTraceabilityproperty tofalse.In the MATLAB Coder™ app, set Enable code traceability to
No.
