Aggregate Execution-Time Profiles to Identify Worst Execution
You can run simulations that test generated code, producing execution-time metrics for the generated code – see Execution-Time Profiling for Generated Code. During model development, you can use the metrics to determine whether the generated code meets performance requirements and identify performance bottlenecks. The information you obtain is simulation-specific and dependent on the test inputs. Near the end of model development, you can:
Use your test bench to rerun all your tests.
Aggregate execution-time profiles produced by the tests.
You can perform the steps manually or automatically depending on how you provide model inputs and run simulations.
Use the aggregate of execution-time profiles to:
Identify the longest execution time for tasks.
Identify the test case that produces the longest execution.
Examine the function-call stack for the longest execution.
Note
The analysis aggregates profiles from the simulations that you run and provides a worst execution time that is based on the test cases you provide. The analysis does not estimate the theoretical worst-case execution time for the generated code.
Workflow for Creating Aggregate of Execution-Time Profiles
To create an aggregate of execution-time profiles, use this workflow:
Using the Simulink® model, design, and optimize your algorithm.
Configure the model to run the generated code and perform code execution profiling, using one of these simulations:
Software-in-the-loop (SIL), which you run on your development computer.
Processor-in-the-loop (PIL), which you run on target hardware by using a target support package or a custom target application.
XCP-based external mode, which you run on your development computer.
Create a
coder.profile.ExecutionTimeSetobject for storing execution-time profiles.For all your test cases:
Configure model inputs.
Run a simulation.
Add the execution-time profile created by the simulation to the
coder.profile.ExecutionTimeSetobject.
If you have a Simulink Test™ file of test cases or a model that provides inputs, you can use
coder.profile.test.runTeststo automate this step.
Use the Code Profile Analyzer to process the aggregate of profiles, which enables you, for example, to identify the longest execution for each task. If the test cases cover system requirements and exercise as many as possible code paths, you can identify and analyze performance hotspots in the generated code.
Manually Aggregate Execution-Time Profiles and Identify Worst Task Execution
In this example:
Using specific test inputs, run SIL simulations that exercise different paths in a model and generated code.
Aggregate execution-time profiles produced by the SIL simulations.
Identify the test input and code path that produce the longest execution time.
Open a model that uses a SIL simulation to generate a workspace variable containing execution-time measurements.
openExample('ecoder/SILPILVerificationExample', ...
             supportingFile='SILTopModel.slx')
model = bdroot;
Disable Simulink Coverage™ and third-party code coverage analysis.
set_param(model,...
          'CovEnable', 'off');
covSettings = get_param(model, 'CodeCoverageSettings');
covSettings.CoverageTool = 'None';
set_param(model, 'CodeCoverageSettings', covSettings);
Configure code execution time profiling.
set_param(model,...
          'CodeExecutionProfiling', 'on');
set_param(model,...
          'CodeProfilingInstrumentation', 'Detailed');
set_param(model,...
          'CodeProfilingSaveOptions', 'AllData');
Create an object for storing results from model simulations.
resultsObject = coder.profile.ExecutionTimeSet(model);
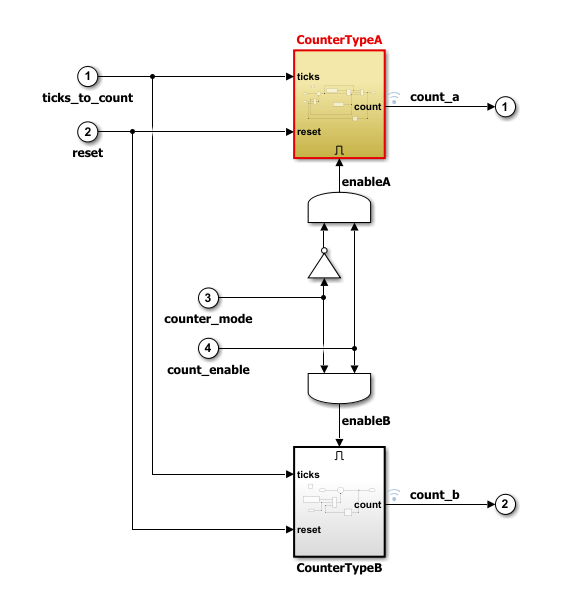
The example model contains two triggered subsystems. The third and
fourth inputs, counter_mode and
count_enabled, control the execution of the
triggered subsystems. To simplify the analysis, assume that the first
and second inputs, ticks_to_count and
reset, contain values that exercise all associated
code paths.
To analyze execution-time metrics for different test cases, run multiple simulations, storing results after each simulation.
First, run a simulation that allows you to analyze execution times
for the case where CounterTypeA is triggered and
CounterTypeB is
disabled.
counter_mode.signals.values = false(1,101)';
simOut = sim(model, 'ReturnWorkspaceOutputs', 'on');
resultsObject.add('CounterA Test', simOut.executionProfile);
Next, run a simulation where only CounterTypeB is
triggered.
counter_mode.signals.values = true(1,101)';
simOut = sim(model, 'ReturnWorkspaceOutputs', 'on');
resultsObject.add('CounterB Test', simOut.executionProfile);
Finally, run a simulation to observe the effect of the
count_enable input. For this simulation, create a
test case that:
After each step, enables or disables the counters.
In the first half of the simulation, uses
CounterTypeA.In the second half of the simulation, uses
CounterTypeB.
count_enable.signals.values(1:2:end) = false;
counter_mode.signals.values(1:50) = false;
counter_mode.signals.values(51:end) = true;
simOut = sim(model, 'ReturnWorkspaceOutputs', 'on');
resultsObject.add('Count Enable Test', simOut.executionProfile);
If you want to extract specific simulation results from the object,
use the get function. For
example:
executionProfileForCounterATest = resultsObject.get('CounterA Test');To analyze results contained in the profile aggregate, run:
coder.profile.show(resultsObject);
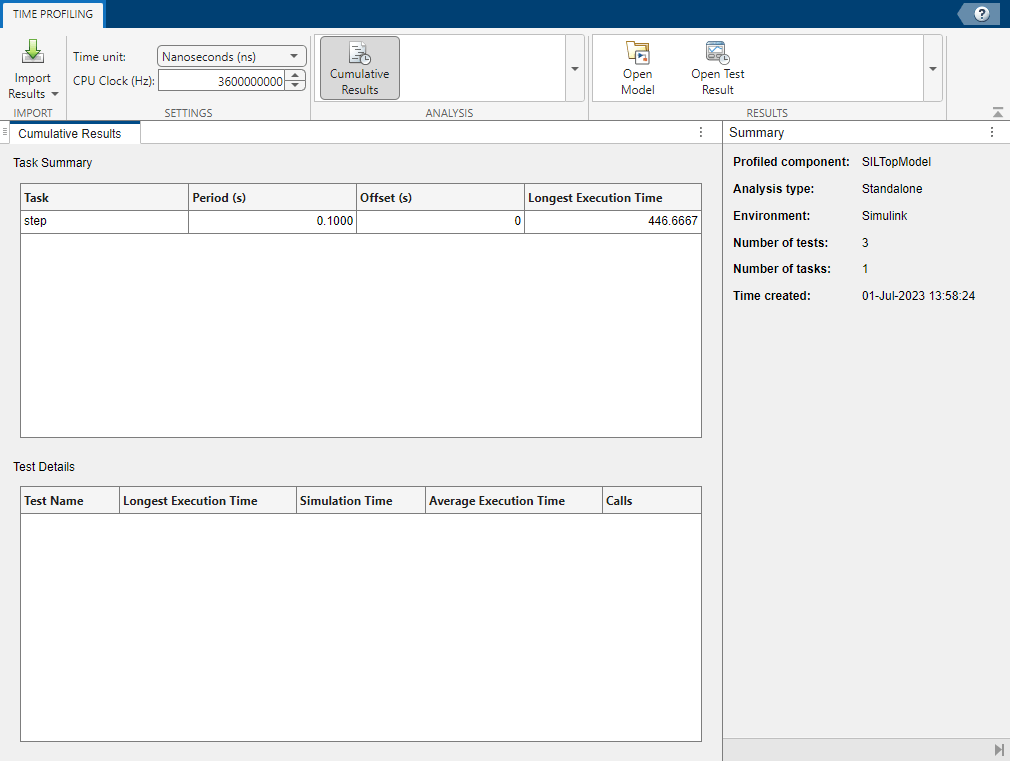
On the Cumulative Results panel, the
Task Summary view displays profiled tasks. For
this model, only a single task, step, is generated.
To investigate the task, click the row that contains
step.
The Test Details view displays details of the five longest executions for each simulation.
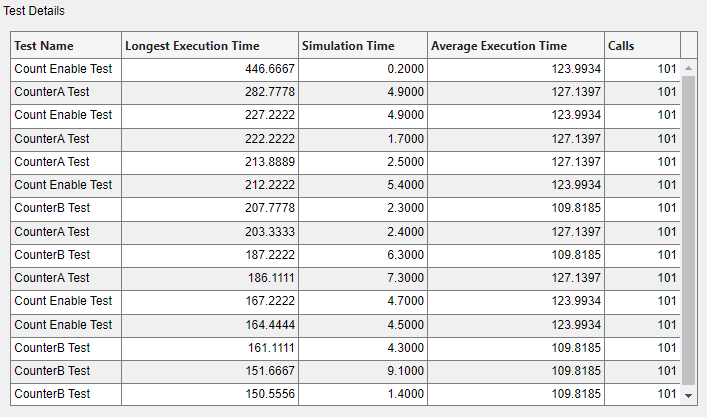
The columns provide this information:
Test Name — Name of test. For example,
CounterA Test,CounterB Test, orCount Enable Test.Longest Execution Time — Time taken for execution of the task. In this example, the column provides times for the longest five executions in each simulation.
Simulation Time — Simulation time at which maximum task execution time occurred.
Average Execution Time — Average value of task execution time over simulation.
Calls — Number of task calls.
If you want to view details for a different number of task
executions, modify the ResultsPerTest property of the
coder.profile.ExecutionTimeSet object. For example,
in the Command Window, enter:
resultsObject.ResultsPerTest=10;
The most demanding execution of the step task occurs in
Count Enable Test and takes 446.7 ns. The
other Longest Execution Time values suggest that
the most demanding execution for Count Enable Test is
an outlier.
To identify the corresponding code or model path for the most demanding execution:
In the Test Details view, click the row that contains the longest task execution time.
In the Results section of the toolstrip, click Open Test Result. The Code Profile Analyzer displays the profile for
Count Enable Test.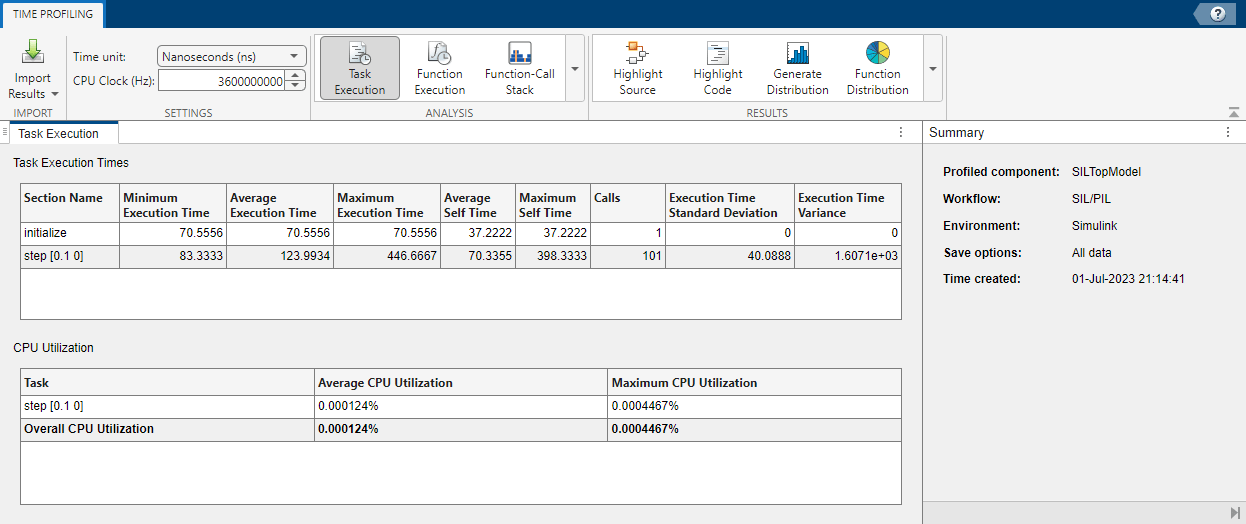
In the Analysis section of the toolstrip, click Function-Call Stack.
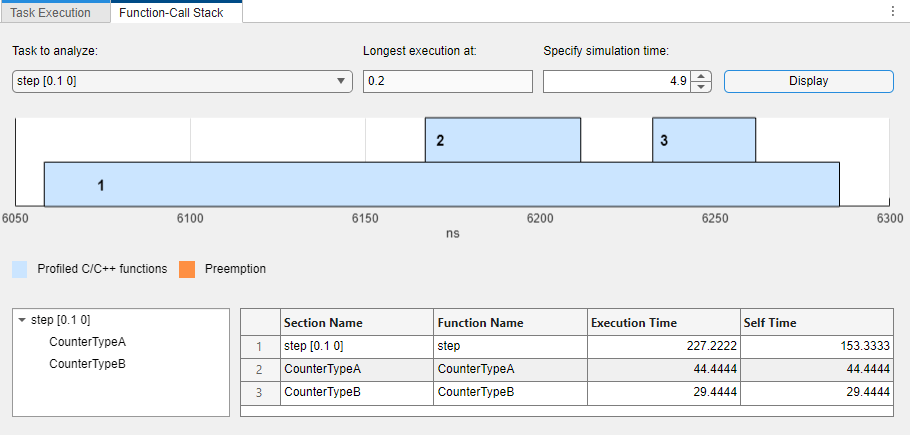
On the Function-Call Stack panel, from the Task to analyze drop-down list, select
step [0.1 0].Click Display. The panel displays the function-call stack, which indicates the code or model path for the simulation step.
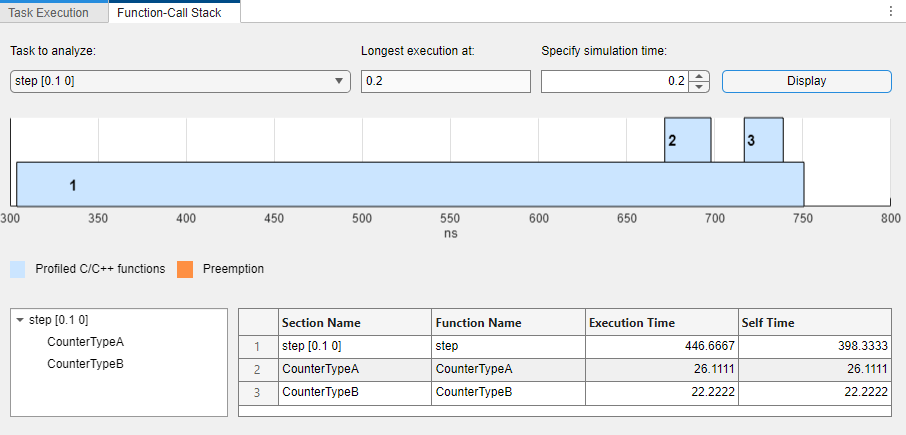
To identify the code or model path for a less demanding execution
from Count Enable Test:
In the Specify simulation time field, enter the simulation time at which the task execution is less demanding. For example, 4.9.
Click Display.
Use the function-call stack displays from both executions to analyze and compare the code or model paths.
Automate Identification of Hotspots in Generated Code
This example shows how you can use coder.profile.test.runTests to identify and analyze
performance hotspots in generated code:
For tasks, identify the longest task executions, which enables you to check whether the tasks meet your execution-time requirements.
For functions, identify the function calls in the generated code that use up most of the execution time.
Open the model.
openExample('ecoder/SILPILVerificationExample', ...
             supportingFile='SILTopModel.slx')
model = bdroot;
If you do not have a test file that covers your system and code path
requirements, you can use coder.profile.test.generateTests to create a file that
contains Simulink
Design Verifier™ test cases for the
model.
myTestFile = coder.profile.test.generateTests(model)
Run the model tests. A Simulink Test license is required.
TimeSet = coder.profile.test.runTests(model, ...
                                      TestFile=myTestFile, ...
                                      CodeMetric="time");
To view results in the Code Profile Analyzer, run:
coder.profile.show(TimeSet);
The Cumulative Results panel displays the Task Summary and Test Details views. Use both views to identify, for each task, the longest execution time and the test that produced the time. When you select a task in the Task Summary view, the Test Details view lists, in order of execution time, the tests that triggered the execution of the selected task.
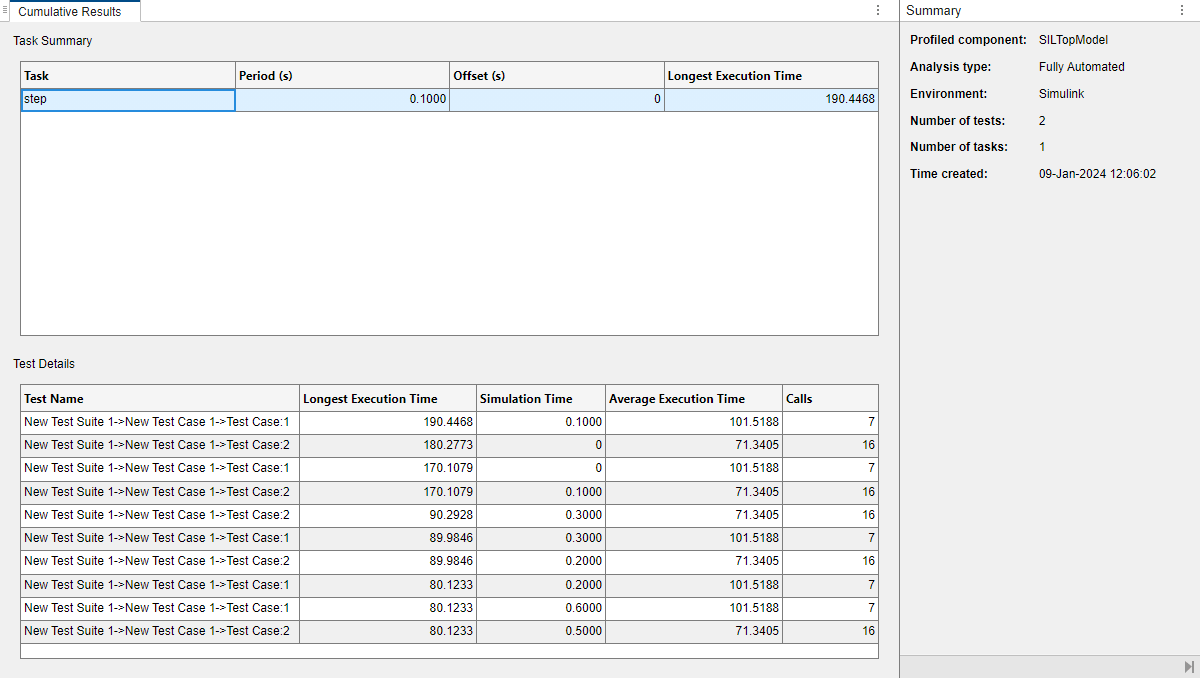
In the Test Details view, the columns provide this information:
Test Name — Name of simulation or test case. For example,
New Test Suite 1->New Test Case 1->Test Case:1.Longest Execution Time — For selected task, longest execution time over simulation.
Simulation Time — Simulation time at which longest task execution time occurred.
Average Execution Time — Average value of task execution time over simulation.
Calls — Number of task calls.
In this example, the most demanding execution of the
step task occurs in New Test Suite 1->New
Test Case 1->Test Case:1, taking 190.4 ns to
complete.
To examine the function-call stack for the longest execution:
In the Analysis section of the toolstrip, click the Flame Graph button.
On the Flame Graph panel, from the Task to analyze drop-down list, select a task. For example,
step [0.1 0].Click Display. The panel displays the function-call stack in the form of a flame graph.
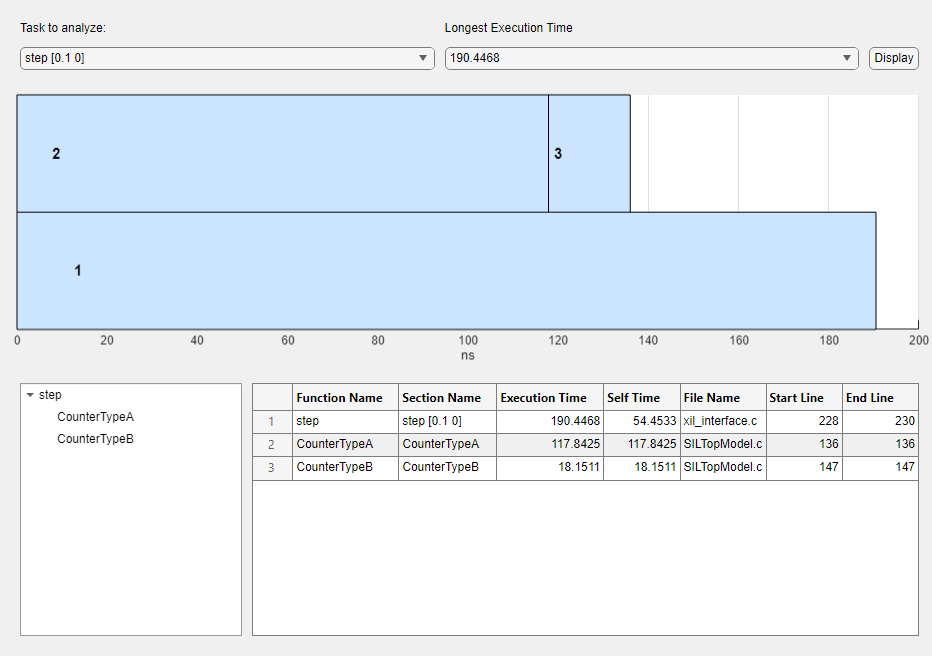
The flame graph helps you to understand what contributes to execution time and identify performance bottlenecks.
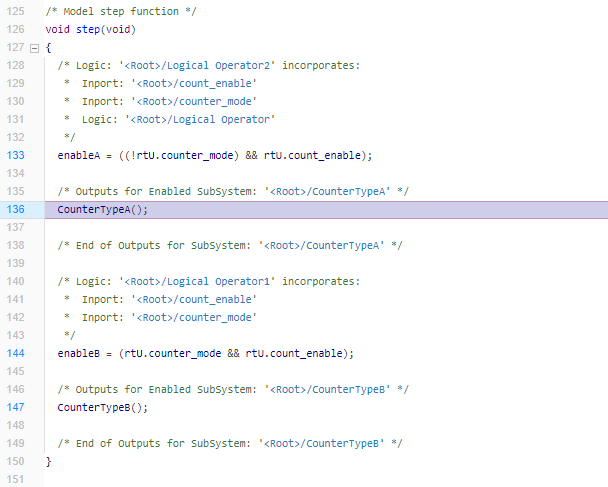
To view a function call in the generated code:
In the function-call tree or metrics table, click the function. For example, click
CounterTypeA, which is called bystep.On the toolstrip, in the Results section, click Highlight Code. The code generation report displays the function call.
To trace the block associated with a generated function and its metrics:
In the function-call tree or metrics table, click the function. For example,
CounterTypeA, which is called bystep.On the toolstrip, in the Results section, click Highlight Source. The Simulink Editor identifies the block.
See Also
coder.profile.ExecutionTimeSet | coder.profile.test.runTests | coder.profile.test.generateTests | Code
Profile Analyzer