Specify Plot Settings for Linear Analysis
You can use the Control System Toolbox™ editors to set properties and settings in Control System Designer, Linear System Analyzer, and any response plots that you create from the MATLAB® command line.
Properties refer to settings that are specific to an individual response plot, such as:
Axes labels and limits
Data units and scales
Plot styles, such as grids and fonts
Plot characteristics, such as rise time, peak response, and stability margins
Settings refer to properties that persist either within a single app session or across Control System Toolbox sessions.
To control the visualization of time-domain and frequency-domain response plots, you can specify the following:
Toolbox settings — Apply to all Control System Toolbox response plots. For more information, see Specify Toolbox Settings for Linear Analysis Plots.
App settings — Apply to the current app session. For more information on configuring settings for:
Linear System Analyzer, see Specify Linear System Analyzer Settings.
Control System Designer, see Specify Control System Designer Settings.
Plot properties — Apply to individual response plots. For more information on setting plot properties, see:
When you update toolbox or app settings, the new configuration applies only to new plots and does not affect existing plots.
Property and Settings Hierarchy
This figure shows the inheritance hierarchy from toolbox settings to plot properties.
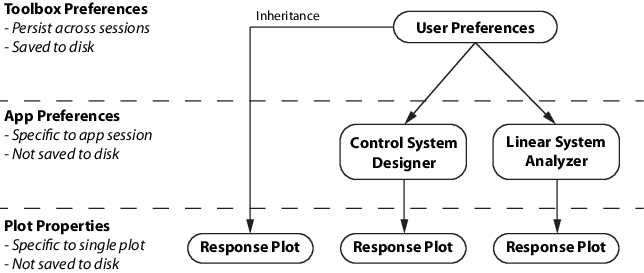
When you open a new app session, the app settings are inherited from the toolbox settings. You can then customize the app settings for that session. When you save a Control System Designer session, the settings for that session are also saved.
Response plot properties are inherited from:
Toolbox settings when the plots are created at the command line.
App settings when the plots are created in an app.
After you create a response plot, you can then modify its properties to values that differ form the toolbox or app settings.