Save and Share Simulation Data Inspector Data and Views
R2026bAfter you inspect, analyze, or compare your data in the Simulation Data Inspector, you can share your results with others. The Simulation Data Inspector provides several options for sharing and saving your data and results depending on your needs. With the Simulation Data Inspector, you can:
Save your data and layout modifications across multiple tabs (since R2026b) in a Simulation Data Inspector session.
Share your layout modifications in a Simulation Data Inspector view.
Share images and figures of plots you create in the Simulation Data Inspector.
Create a Simulation Data Inspector report.
Export data to the workspace.
Export data to a file.
Save and Load Simulation Data Inspector Sessions
To save or share data along with a configured view in the Simulation Data Inspector, save your data and settings in a Simulation Data Inspector session. Sessions are saved as MLDATX files (a MATLAB® data exchange format). When you save a Simulation Data Inspector session, the session file contains:
All runs, data, and properties from the Inspect pane, including which run is the current run and which runs are in the archive
Tabs, subplot layout, visualization choices, and plotted signals in the Inspect pane
Current signal or run comparison in the Compare pane
Subplot customizations such as axis limits, grid lines, and legend position
Plotted signal customizations such as line style and color selections
To save a Simulation Data Inspector session:
Click the save icon
 on the left side bar to open the Save Session dialog
box.
on the left side bar to open the Save Session dialog
box.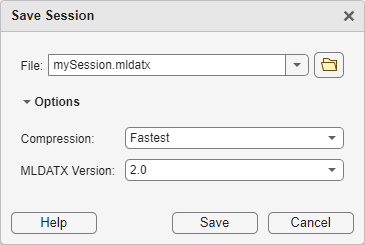
In the Save Session dialog box, you can name the session file, specify the MLDATX file version, and set Compression to one of these options:
Balanced for size and speedcreates a file that is balanced between the speed ofFastestand the file size ofCompact.Fastest, the default, creates a smaller file size than an uncompressed file, with a comparable save speed.Compactcreates the smallest file size.Nonedoes not compress the file. This option creates the largest file size but has the fastest save time.
Click Save or press Ctrl+S to save your session file. For large data sets, a status overlay in the bottom right of the graphical viewing area displays information about the progress of the save operation and allows you to cancel the save operation.
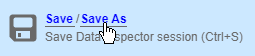
To save a previously saved session with a new filename or to change the version or
compression options, pause on the save icon on the left side bar. Then, click Save
As.
Note
After you initially save a session, clicking the Save button
or pressing Ctrl+S saves the session as an MLDATX version 2.0
file using the default compression Fastest. To maintain
compression and version options other than the defaults, click the Save
As button.
To load a Simulation Data Inspector session:
Click the open icon
 on the left side bar.
Browse to select the MLDATX file you want to open.
Click Open.
Alternatively, you can double-click the MLDATX file. MATLAB and the Simulation Data Inspector open if they are not already open.
Before R2024b: To load Simulation Data Inspector session files, save files in the MLDATX 1.0 file format.
When the Simulation Data Inspector already contains runs, loading a session file opens the Open Session dialog box. Using the Open Session dialog box, you can choose to:
Clear existing runs from the Simulation Data Inspector and add data from the session file to the work area.
Keep existing data in the Simulation Data Inspector and add data from the session file to the archive.
In both cases, the view updates to show the saved tabs (since R2026b), plotted signals, and visualization configuration from the session file. You can drag runs between the work area and archive as needed.
When the Simulation Data Inspector does not contain runs and you open a session, the Simulation Data Inspector puts runs in the work area and archive as specified in the file.
Share Simulation Data Inspector Views
When you have different sets of data that you want to visualize the same way, you can save a view. A view saves the layout and appearance characteristics of the Simulation Data Inspector for all open tabs without saving the data. Specifically, a view saves:
Tabs, plot visualization type, layout, axis ranges, linking characteristics, and normalized axes
Location of signals in the plots
Signal grouping and columns on display in the Inspect pane
Signal color and line styling
To save a view:
Click Visualizations and layouts
 .
.In Saved Views, click Save current view.
In the dialog box, specify a name for the view and browse to the location where you want to save the MLDATX file.
Click Save.
When you load a view, the Simulation Data Inspector uses the properties and preferences in the file to display data currently in the Simulation Data Inspector. Signals in the Simulation Data Inspector must align with the signals in the view according to these properties, in order:
Block path
Signal ID
Signal name
To load a view:
Click Visualizations and layouts
.In Saved Views, click Open saved view.
Browse to the view you want to load, and click Open.
Before R2026b: When you load a session file that contains multiple tabs, the Simulation Data Inspector loads only the view from the tab that was active when the session was saved.
Note
Log or import data into the Simulation Data Inspector before loading a saved view. The software applies a saved view only if the Simulation Data Inspector contains signals that align with the view. If there are no matching signals, the view is not applied and any new logged or imported signals do not inherit the visualization settings in the saved view.
Share Simulation Data Inspector Plots
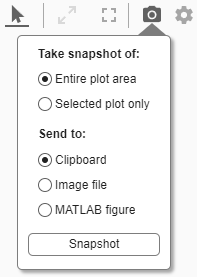
Use the snapshot feature to share the plots you generate in the Simulation Data Inspector. You can export your plots from the active tab to the clipboard to paste into a document, as an image file, or to a MATLAB figure. You can choose to capture the entire plot area in the active tab, including all subplots in the plot area, or to capture only the selected subplot.
Click the camera icon  on the toolbar to access the snapshot menu. Use the
radio buttons to select the area you want to share and how you want to share the plot.
After you make your selections, click Snapshot to export the plot.
on the toolbar to access the snapshot menu. Use the
radio buttons to select the area you want to share and how you want to share the plot.
After you make your selections, click Snapshot to export the plot.
If you create an image, select where you want to save the image in the file browser.
You can also create snapshots of your plots in the Simulation Data Inspector programmatically
using Simulink.sdi.snapshot (Simulink).
Create Simulation Data Inspector Report
To quickly generate documentation of your results, create a Simulation Data Inspector report. You can create a report of your data in either the Inspect or the Compare pane. The report is an HTML file that includes information for all plotted signals across all tabs. For each tab, the report contains the tab name, run name, signal information displayed, and subplot images. For more information about configuring the table, see Inspect Signal, Run, and Comparison Metadata (Simulink).
To generate a Simulation Data Inspector report:
Click the create report icon
 on the left bar.
 When you create a report while viewing the Inspect pane, the report includes the plots and signals from the Inspect pane.
When you create a report while viewing the Compare pane, the report includes the data and plots from the Compare pane. When you generate a comparison report, you can select Report only mismatched signals or Report all signals. If you select Report only mismatched signals, the report shows only signal comparisons that are not within the specified tolerances.
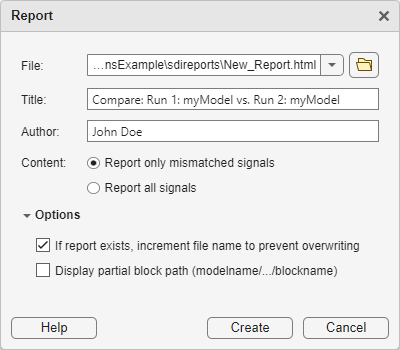
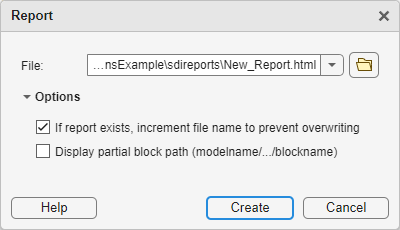
In the File text box, specify a filename and location of where you want to save the report.
Under Options, you can choose whether to prevent overwriting files and whether to use shortened block paths in the report.
Click Create.
The generated report automatically opens in your default browser.
See Also
Functions
Simulink.sdi.saveView(Simulink)
Topics
- View Simulation Data in Simulation Data Inspector (Simulink)
- Inspect Simulation Data (Simulink)
- Compare Simulation Data (Simulink)

