Evaluate Performance of Cell-Free mMIMO Networks
This example shows how to evaluate the performance of cell-free (CF) massive multiple-input multiple-output (mMIMO) networks with full physical layer processing. Using this example, you can assess both centralized and distributed implementations of these networks and analyze cell performance across different channel delay profiles. Key performance indicators (KPIs) evaluated include cell throughput, spectral efficiency, and block error rate (BLER).
CF mMIMO
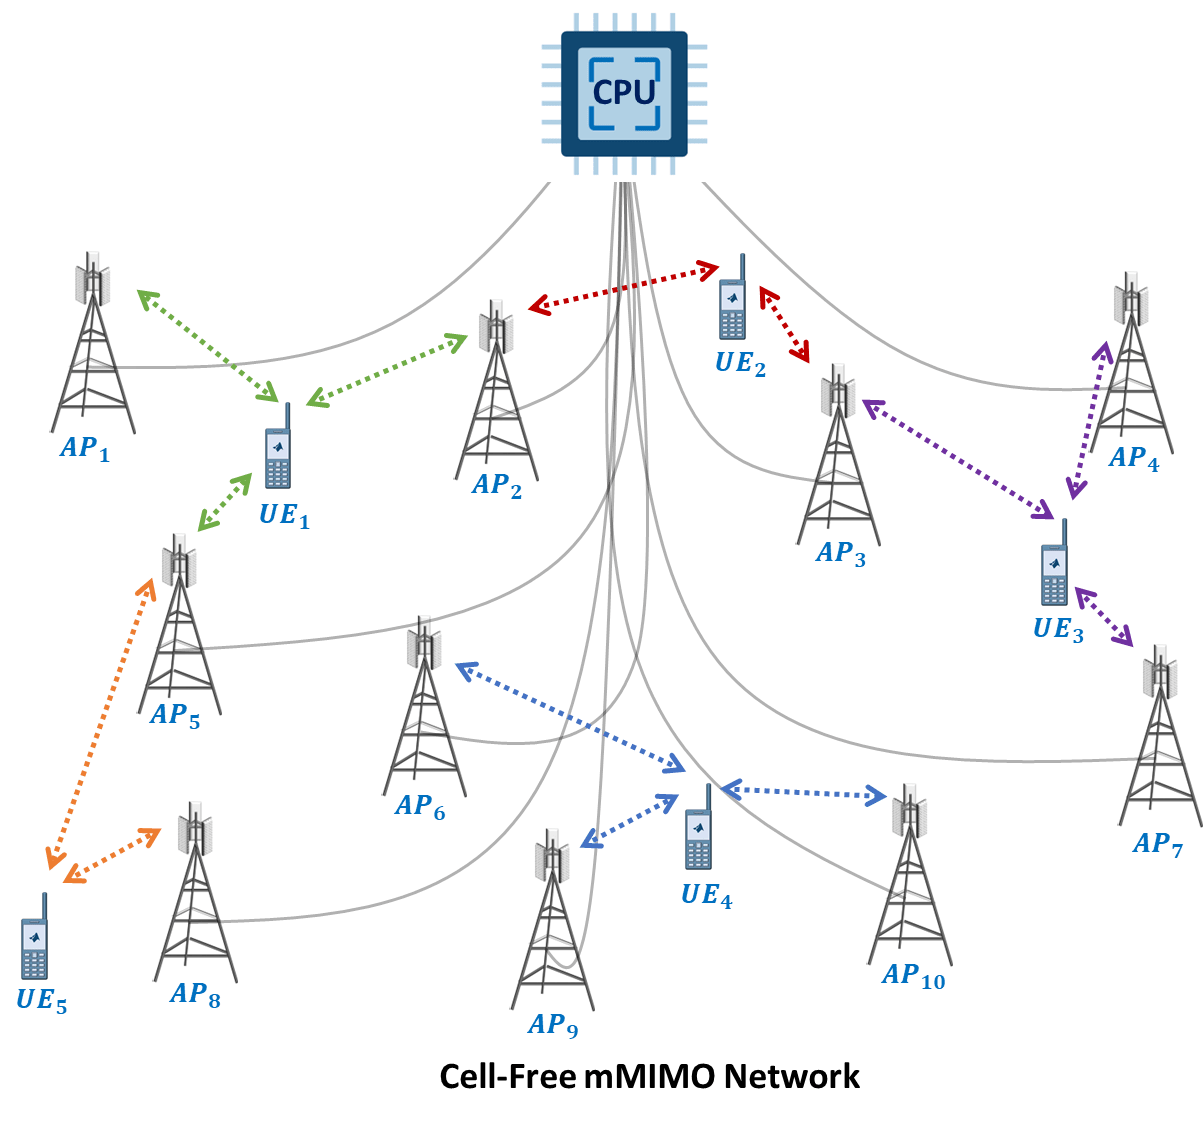
A CF mMIMO network consists of numerous geographically distributed access points (APs) that jointly serve user equipment (UE) nodes, as illustrated in this figure. A central processing unit (CPU) controls all APs, performing resource allocation and scheduling. A fronthaul connection, with assumed unlimited capacity, negligible latency, and error-free transmission, links the APs to the CPU. UE nodes can wirelessly connect to multiple APs and decode the combined signal from the connected APs.
Simulation Assumptions
This example makes these assumptions:
The duplex mode is time division duplex (TDD).
Channel estimations for all links (channel coefficients) are perfect, calculated from the path gains and path filters of the channel.
The example does not model the channel state information reference signal (CSI-RS).
Downlink (DL) and uplink (UL) measurements exploit TDD reciprocity using sounding reference signals (SRS).
This example uses full physical layer processing.
The fronthaul, which refers to links between the CPU and APs, has unlimited capacity, negligible latency, and error-free transmission.
Implementation Approaches for Cell-Free mMIMO Networks
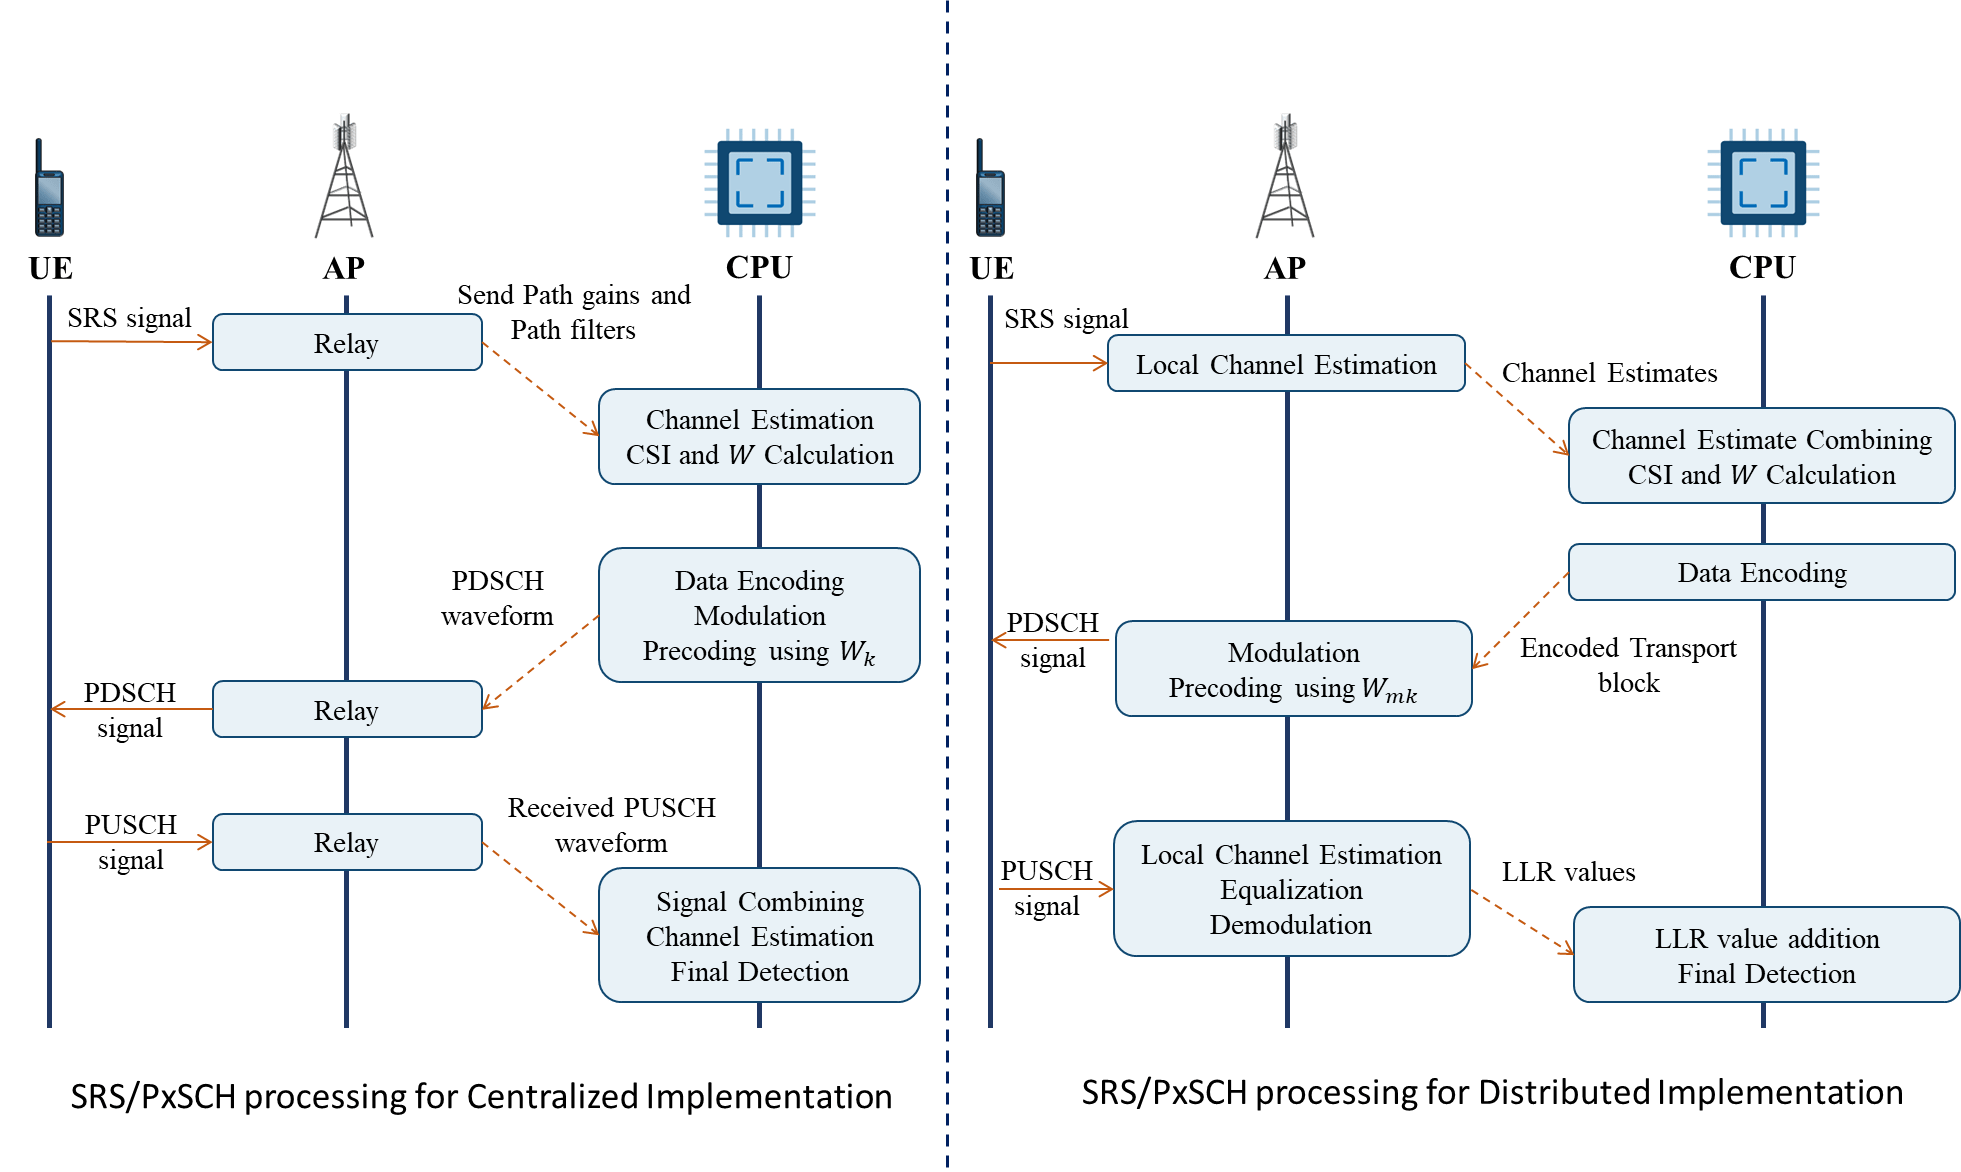
Cell-free mMIMO systems typically use one of two implementations: centralized or distributed, as illustrated in this figure. In the centralized implementation, the CPU performs physical layer processing while the APs relay signals between the CPU and the UEs. In the distributed implementation, the CPU and the APs share physical layer processing. The distributed approach reduces computational complexity at the CPU and lowers the fronthaul load between the CPU and the APs.
SRS Processing
While setting up its connection with UE nodes, the CPU transmits the sounding reference signal (SRS) configuration to the UE nodes. APs then receive the SRS signal from the configured UE nodes in a specific time slot. The channel estimation process varies depending on whether the CF mMIMO system uses a centralized or distributed implementation strategy. In the centralized implementation of CF mMIMO, each AP relays the channel path gains and path filters impulse response to the CPU, which then estimates a combined channel from all APs.
In the distributed implementation, each AP locally estimates the channel and sends these estimates to the CPU, which concatenates them to form the combined channel estimate, expressed as:
, where is the estimated channels between AP-and .
Precoder Computation
To compute the DL precoder from the channel estimations available at the CPU, exploit TDD reciprocity and employ zero forcing (ZF) precoding, defined as:
.
For the UL transmissions, the CPU selects a codebook-based UL precoder (TPMI), as specified in TS 138.214.
Physical Downlink Shared Channel (PDSCH) Processing
In the centralized implementation, for each UE, the CPU generates the transmission waveform and relays it through APs, expressed as:
, where is the signal related to AP-.
For a particular AP-, the data received from the CPU for all UE nodes is superimposed as:
= .
In the distributed implementation, the CPU performs transport block (TB) encoding and transmits it to the respective APs along with the required precoding matrix for each UE. The expression for deriving the precoding matrices from for the APs is:
, where represents the precoding matrix corresponding to the link between AP- and .
Physical Uplink Shared Channel (PUSCH) Processing
UE nodes precode the uplink transmission using the codebook-based precoder (TPMI) indicated by the CPU in the UL grant.
In a centralized implementation, AP- receives the signals from all the UEs. Each AP sends the received waveform to the CPU. The CPU combines the waveforms from all the APs, removes the cyclic prefix (CP), and performs FFT operations, LS channel estimation, minimum mean square error (MMSE) equalization, layer demapping, and descrambling to obtain the log-likelihood ratio (LLR) values. These LLR values aid in the TB decoding to detect the transmitted bit sequence.
In a distributed implementation, the AP removes the CP from the received waveform and performs FFT to obtain the receiver grid. The AP uses this grid for the channel estimation, MMSE equalization, layer demapping, and descrambling to obtain the log-likelihood ratio values. The AP transmits these LLR values to the CPU, where the CPU adds them for across the APs as:
This aids in the TB decoding of data.
Scenario Configuration
Check if the Communications Toolbox Wireless Network Simulation Library support package is installed. If the support package is not installed, MATLAB® returns an error with a link to download and install the support package.
wirelessnetworkSupportPackageCheck
Create the wireless network simulator.
rng("default")          % Reset the random number generator
numFrameSimulation = 4; % Simulation time in terms of number of 10 ms frames
networkSimulator = wirelessNetworkSimulator.init;
hPre6GCPU.reset();      % Reset the CPU Cell ID Count
To use full PHY, set the abstraction type to none.
phyAbstractionType = "none"; % Use full physical layer processing split ="Centralized"; % Realization
Set up the simulation parameters.
lengthX = 1000; % Scenario length (meters) in X direction lengthY = 1000; % Scenario length (meters) in Y direction numAPs =20; % Number of APs numUEs =
4; % Number of UEs % numUEConnections should not exceed numAPs numUEConnections =
2; % Number of APs a UE can connect to % Number of AP antennas numTransmitAntennas = 4; numReceiveAntennas = 4;
Create a CPU node with the specified configuration by using the hPre6GCPU function. Set parameters such as position, split, carrier frequency, channel bandwidth, subcarrier spacing, number of transmit antennas, and number of receive antennas.
CPU = hPre6GCPU(Name="CPU-1",Position=[lengthX/2 lengthY+100 10], ...
    Split=split,CarrierFrequency=1.9e9,ChannelBandwidth=20e6, SubcarrierSpacing=15e3, ...
    NumTransmitAntennas=numTransmitAntennas,NumReceiveAntennas=numReceiveAntennas);
Generate AP positions using the generateAPPositions function, setting parameters for the number of APs and the dimensions of the area. Assign names to the APs based on their positions.
[apPositions,apRadius] = generateAPPositions(numAPs,lengthX,lengthY);
apNames = "AP-" + (1:size(apPositions,1));
Create AP nodes with the specified configuration.
APs = hPre6GAP(Name=apNames,Position=apPositions, ...
    TransmitPower=23,NumTransmitAntennas=numTransmitAntennas, ...
    NumReceiveAntennas=numReceiveAntennas,ReceiveGain=0,NoiseFigure=9);
Create a network by connecting the AP nodes to the CPU node.
connectAP(CPU,APs);
Generate UE positions, create UE nodes, and establish connections with the APs.
% Generate positions for the UEs
uePositions = generateUEPositions(numUEs,lengthX,lengthY);
% Initialize UE array
UEs = hPre6GUE.empty(0,numUEs);

for i = 1:numUEs
    % Calculate the distances from the UE to all APs
    distance = sqrt((apPositions(:,1)-uePositions(i,1)).^2+(apPositions(:,2)-uePositions(i,2)).^2);
    [~,closestAPIdx] = sort(distance,"ascend"); % Sort APs by proximity to the UE

    % Generate UE name based on numUEConnections
    ueName = "UE" + i + " AP-";
    for j = 1:numUEConnections
        ueName = ueName + floor(APs(closestAPIdx(j)).APCellID/3);
        if(j ~= numUEConnections)
            ueName = ueName + "-";
        end
    end

    % Create a UE node with the specified configuration
    UEs(i) = hPre6GUE(Name=ueName,Position=uePositions(i,:),TransmitPower=20, ...
        NumTransmitAntennas=1,NumReceiveAntennas=1,ReceiveGain=0,NoiseFigure=9);

    % Connect the UE to the nearest APs
    for j = 1:numUEConnections
        APs(closestAPIdx(j)).connectUE(UEs(i), FullBufferTraffic="on");
    end
end
Add the CPU, AP, and UE nodes to the simulator.
addNodes(networkSimulator,CPU)
addNodes(networkSimulator,APs)
addNodes(networkSimulator,UEs)
Create an N-by-N matrix of link-level channels, where N is the total number of nodes in the system. The element at index (i,j) contains the channel instance from node i to node j. An empty element indicates that the channel between the corresponding nodes is not modeled.
numNodes = length(CPU) + numAPs + numUEs;
channels = cell(numNodes,numNodes);
channelConfig = struct(DelaySpread=300e-9);
for i = 1:numAPs
    channels = createCDLChannels(channels,channelConfig,APs(i),UEs);
end
Create a custom channel model using channels, and add the custom channel to the simulator. The network simulator applies the custom channel to a packet in transit before passing it to the receiver.
customChannelModel = hNRCustomChannelModel(channels,struct(PHYAbstractionMethod=phyAbstractionType));
addChannelModel(networkSimulator,@customChannelModel.applyChannelModel)
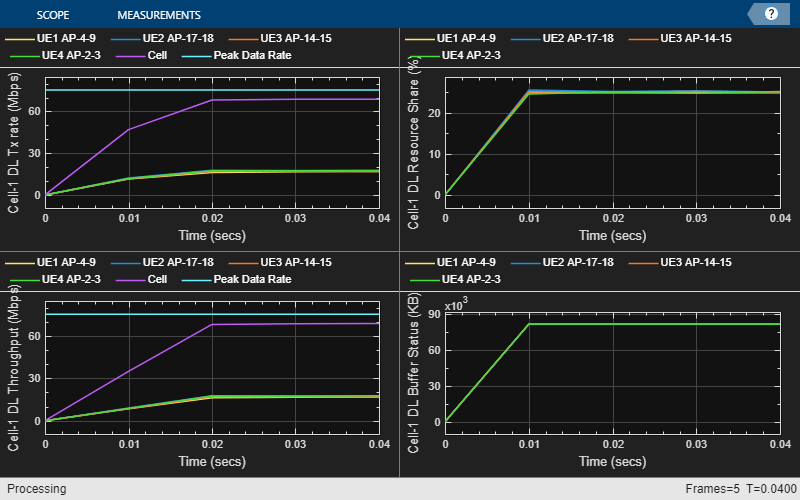
Set up the metric visualizer for plotting graphs.
enablePHYPlot =true; % Enable plotting of PHY metrics. enableSchPlot =
true; % Enable plotting of scheduler metrics. enableCDFPlot =
true; % Enable plotting of CDF metrics. numMetricsSteps = numFrameSimulation; % Set the number of metric steps equal to the number of simulation frames. % Initialize the metric visualizer with the specified settings. metricsVisualizer = helperNRMetricsVisualizer(CPU,UEs,NumMetricsSteps=numMetricsSteps, ... PlotSchedulerMetrics=enableSchPlot,PlotPhyMetrics=enablePHYPlot,PlotCDFMetrics=enableCDFPlot);
Enable visualization of the scenario.
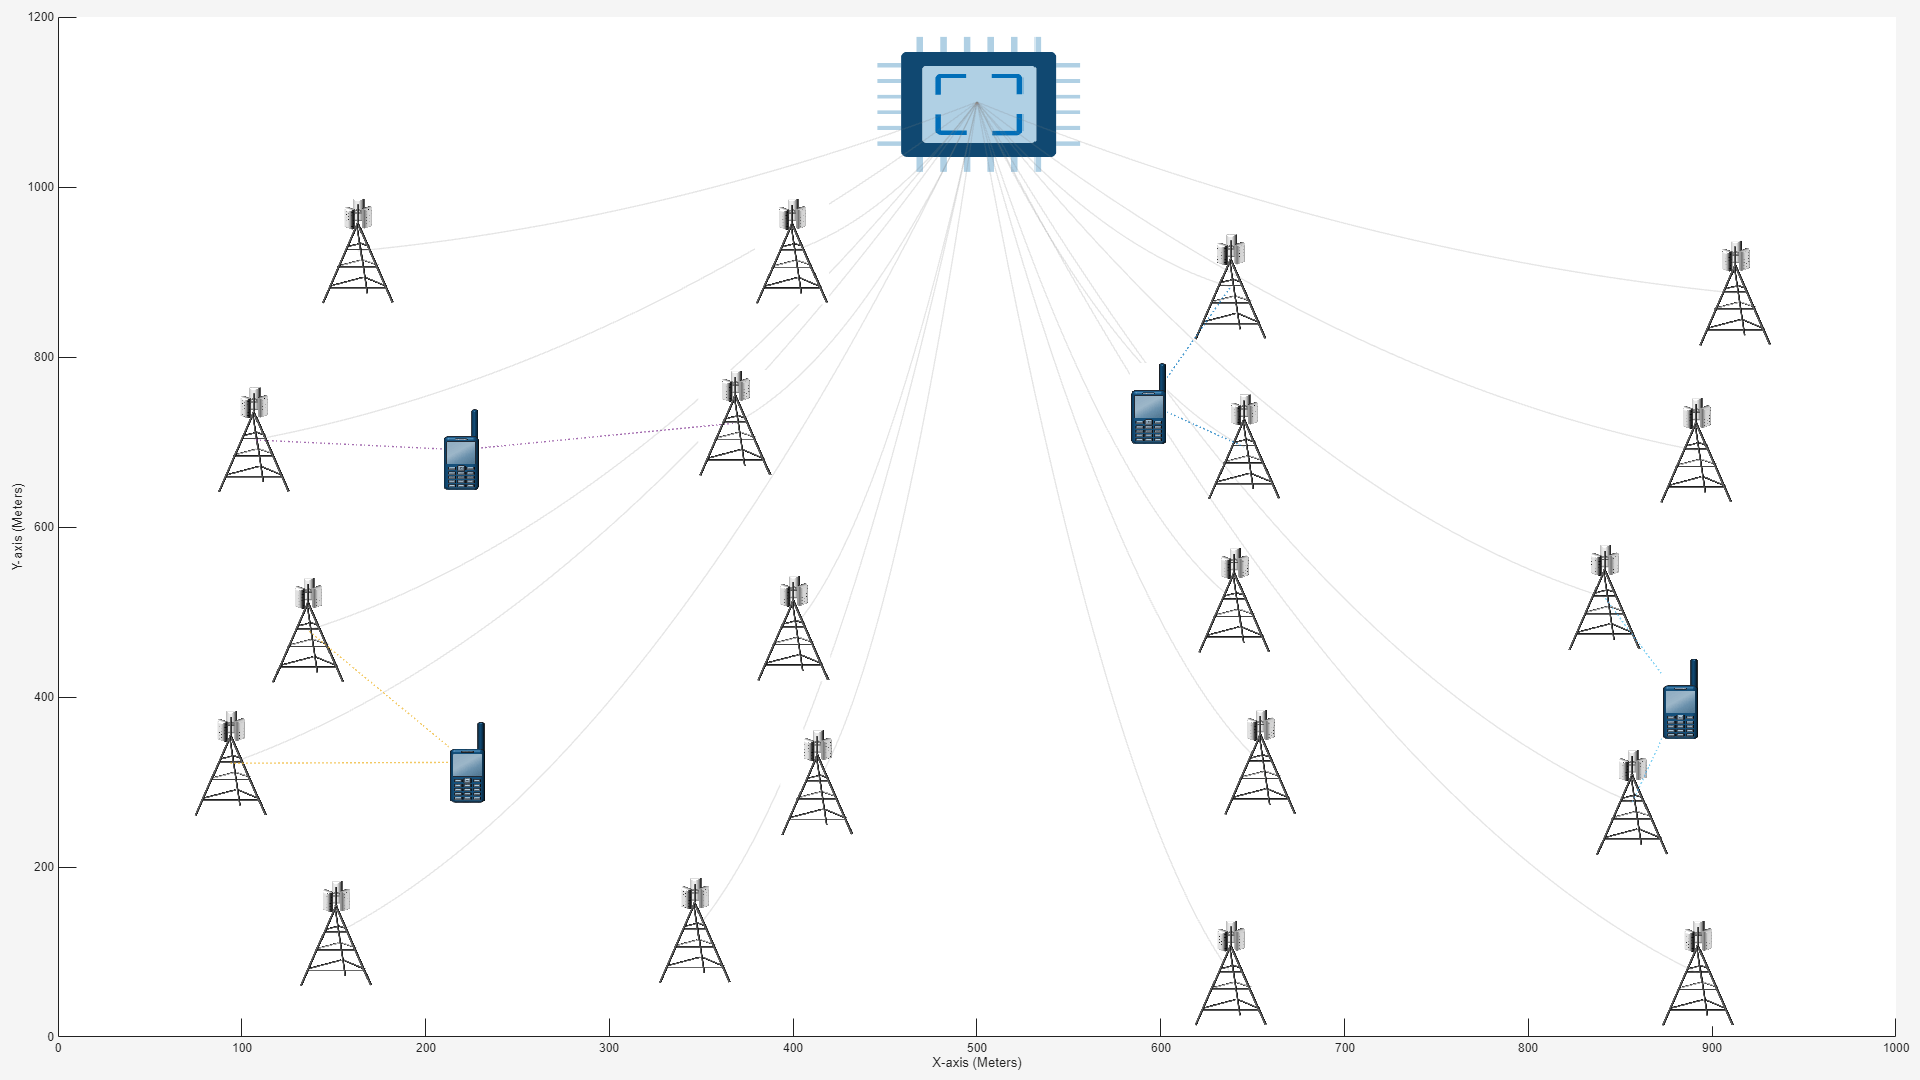
enableVisualization =true; if enableVisualization hPre6GNetworkVisualizer(); end
Run the simulation for numFrameSimulation frames.
% Calculate the simulation duration (in seconds)
simulationTime = numFrameSimulation*1e-2;

% Run the simulation
run(networkSimulator,simulationTime)
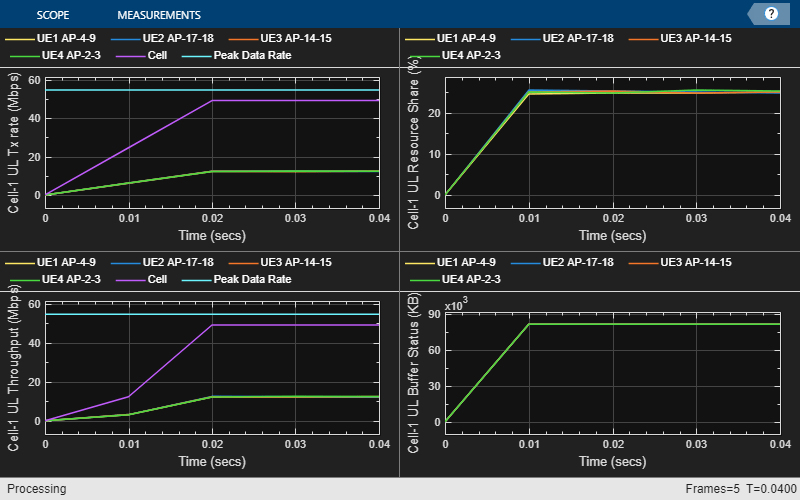

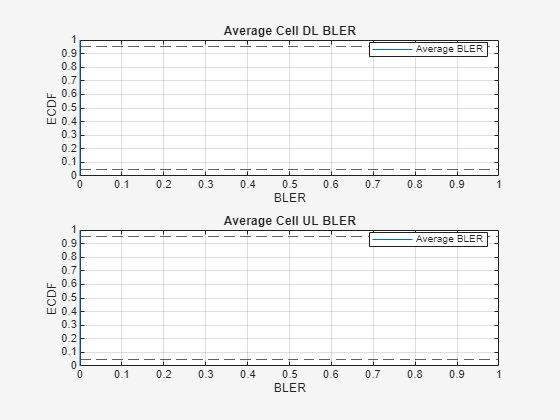

Read per-node statistics.
cpuStats = CPU.statistics();
ueStats = UEs.statistics();
Compare the achieved value for system performance indicators with their theoretical peak values (considering zero overheads).
displayPerformanceIndicators(metricsVisualizer);
Peak UL throughput: 54.64 Mbps. Achieved cell UL throughput: 39.95 Mbps
Achieved UL throughput for each UE: [9.9        10.03           10        10.03]
Peak UL spectral efficiency: 2.73 bits/s/Hz. Achieved UL spectral efficiency for cell: 2.00 bits/s/Hz
Block error rate for each UE in the UL direction: [0  0  0  0]

Peak DL throughput: 75.37 Mbps. Achieved cell DL throughput: 60.19 Mbps
Achieved DL throughput for each UE: [14.54        15.48        14.88        15.29]
Peak DL spectral efficiency: 3.77 bits/s/Hz. Achieved DL spectral efficiency for cell: 3.01 bits/s/Hz
Block error rate for each UE in the DL direction: [0  0  0  0]
The displayPerformanceIndicators function displays these performance indicators: the achieved data rate (UL and DL), the achieved spectral efficiency (UL and DL), and the achieved block error rate (UL and DL). This example calculates the peak values as per 3GPP TR 37.910.
Local Functions
createCDLChannels sets up CDL channel instances for each DL and UL link in the cell.
function channels = createCDLChannels(channels,channelConfig,AP,UEs)
    %createCDLChannels Creates channels between the AP node and UE nodes in a cell
    %   CHANNELS = createCDLChannels(CHANNELS,CHANNELCONFIG,AP,UES) creates channels
    %   between AP and UES in a cell.
    %
    %   CHANNELS is an N-by-N array, where N is the number of nodes in the cell.
    %
    %   CHANNLECONFIG is a structure with these fields: DelayProfile and
    %   DelaySpread.
    %
    %   AP is an hPre6GAP node.
    %
    %   UES is an array of hPre6GUE nodes.
    % Create a channel matrix to hold the channel objects

    % Get the sample rate of waveform
    waveformInfo = nrOFDMInfo(AP.NumResourceBlocks,AP.SubcarrierSpacing/1e3);
    sampleRate = waveformInfo.SampleRate;
    channelFiltering = strcmp(AP.PHYAbstractionMethod,"none");
    numUEs = length(UEs);

    % Create a CDL channel model object configured with the desired delay
    % profile, delay spread, and Doppler frequency
    channel = nrCDLChannel;
    channel.CarrierFrequency = AP.CarrierFrequency;
    channel.DelaySpread = channelConfig.DelaySpread;
    channel.ChannelFiltering = channelFiltering;
    channel.SampleRate = sampleRate;

    for ueIdx = 1:numUEs
        % Configure the DL channel model between AP and UE
        cdl = hMakeCustomCDL(channel);
        cdl.Seed = 73 + (ueIdx - 1);
        cdl = hArrayGeometry(cdl,AP.NumTransmitAntennas,UEs(ueIdx).NumReceiveAntennas, ...
            "downlink");

        % Compute the LOS angle from AP to UE
        [~,depAngle] = rangeangle(UEs(ueIdx).Position',AP.Position');

        % Configure the azimuth and zenith angle offsets for this UE
        cdl.AnglesAoD(:) = cdl.AnglesAoD(:) + depAngle(1);
        % Convert elevation angle to zenith angle
        cdl.AnglesZoD(:) = cdl.AnglesZoD(:) - cdl.AnglesZoD(1) + (90-depAngle(2));
        channels{AP.ID,UEs(ueIdx).ID} = cdl;

        % Configure the UL channel model between AP and UE
        cdlUL = clone(cdl);
        cdlUL.swapTransmitAndReceive();
        channels{UEs(ueIdx).ID,AP.ID} = cdlUL;
    end
end
generateAPPositions generates the AP positions
function [apPositions,apRadius] = generateAPPositions(numAPs,lengthX,lengthY)
    %generateAPPositions generate AP positions
    % The generateAPPositions function returns the apPositions and apRadius
    % based on the generated positions.
    %
    % Input arguments:
    % numAPs  - Number of APs to be placed.
    % lengthX - Length of the scenario area in the X-direction (meters).
    % lengthY - Length of the scenario area in the Y-direction (meters).
    %
    % Output arguments:
    % apPosition - Matrix of AP positions.
    % apRadius   - Radius of the area covered by each AP

    % Calculate the number of APs to be placed in rows (a) and columns (b) of
    % the scenario area.
    a = round(sqrt(numAPs*lengthX/lengthY));
    while(a > 0)
        b = numAPs/a;
        if b == floor(b)
            break
        end
        a = a - 1;
    end
    flag = 0;
    if a == 1 && b > 3
        flag = 1;
        a = round(sqrt((numAPs-1)*lengthX/lengthY));
        while(a > 0)
            b = (numAPs-1)/a;
            if b == floor(b)
                break
            end
            a = a - 1;
        end
    end

    % Create segments of the scenario area.
    subX = lengthX/a;
    subY = lengthY/b;
    % Calculate radius per AP
    apRadius = max(subX,subY)/2;
    % initialize position array
    x = zeros(numAPs,1);
    y = zeros(numAPs,1);
    k = 1;
    % Define lengths of the random region in sub-segment.
    rx = 0.3*b/(a+b);
    ry = 0.3*a/(a+b);
    for i = 1:a
        for j = 1:b
            if flag && j==b
                continue
            end
            % Assign x and y coordinates with random variation.
            x(k) = subX*(i-(0.5+rx)+2*rx*rand);
            y(k) = subY*(j-(0.5+ry)+2*ry*rand);
            k = k + 1;
        end
    end
    if flag
        subX = lengthX/(a+1);
        for i = 1:(a+1)
            x(k) = subX*(i-(0.5+rx)+2*rx*rand);
            y(k) = subY*(b-(0.5+ry)+2*ry*rand);
            k = k + 1;
        end
    end
    z = 30*ones(numAPs,1); % Set AP height (z-coordinate) to a constant value (30 meters).
    apPositions = [x y z];  % Combine x-, y-, and z-coordinates into a single matrix.
end
generateUEPositions generates UE node positions.
function [uePositions] = generateUEPositions(numUEs,lengthX,lengthY)
    %generateUEPositions Generate random UE positions in a segment
    % This function returns the uePositions
    %
    % numUEs - Number of UEs.
    % lengthX - Scenario length (meters) in X-direction.
    % lengthY - Scenario length (meters) in Y-direction.

    % Initialize position array
    x = zeros(numUEs,1);
    y = zeros(numUEs,1);
    for i = 1:numUEs
        % Distribute UEs in four quadrants
        rx = mod(i,4);
        ry = mod(rx,2);
        x(i) = (floor(rx/2)+rand)*lengthX/2;
        y(i) = (ry+rand)*lengthY/2;
    end
    z = 3*ones(numUEs,1); % UE height in meters
    uePositions = [x y z];
end
Appendix
The example uses these helpers:
hPre6GCPU:– Implements CPU nodehPre6GCPUMAC:– Implements CPU MAC functionalityhPre6GCPUFullPHY:– Implements CPU PHY functionalityhPre6GScheduler:– Implements scheduler functionalityhPre6GAP:– Implements AP nodehPre6GAPLowPHY:– Implements AP lower PHY functionalityhPre6GUE:– Implements UE nodehPre6GUEMAC:– Implements UE MAC functionalityhPre6GUEFullPHY:– Implements UE full PHY functionalityhPre6GNetworkVisualizer:– Implements metric visualization functionalityhArrayGeometry:– Configures antenna array geometry for CDL channel modelhelperNRMetricsVisualizer:– Implements metrics visualization functionalityhNRCustomChannelModel:– Implements channel modeling functionalityhMakeCustomCDL:– Configures CDL with custom delay profile
