Using Signal Multiresolution Analyzer
This example shows how to use Signal Multiresolution Analyzer to visualize a multilevel wavelet-based decomposition of a real-valued 1-D signal.
Load in the Kobe earthquake data. The data are seismograph measurements (vertical acceleration in ) recorded at Tasmania University, Hobart, Australia, on 16 January 1995, beginning at 20:56:51 (GMT) and continuing for 51 minutes at one second intervals.
load kobeOpen Signal Multiresolution Analyzer and click Import. A window appears listing all the workspace variables the app can process.
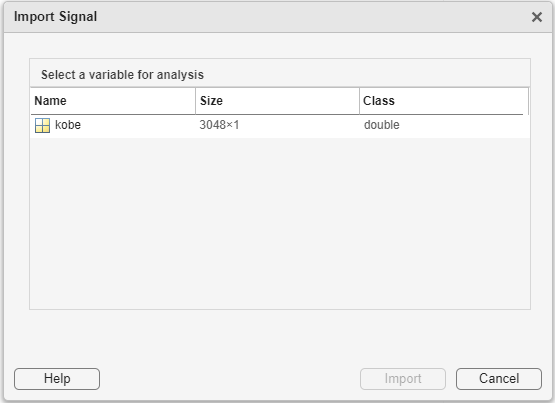
Select the Kobe data from the dialog box and click Import. By default, the app shows the multiresolution analysis (MRA) of a four-level maximal overlap discrete wavelet transform (MODWT) decomposition of the signal in the MODWT tab. The app obtains the decomposition using the modwt and modwtmra functions with default settings. The plots in the Decomposition pane are the projections of the wavelet decompositions of the signal at each scale on the original signal subspace. The decomposed signal is named kobe1 in the Decomposed Signals pane. The method MODWT identifies the decomposition. The original signal, kobe, and the reconstruction, kobe1, are plotted in the Reconstructions pane.

By default, plots are with respect to sample index and frequencies are in cycles per sample. To plot with respect to time and display frequencies in hertz, select the Sample Rate radio button on the Signal Multiresolution Analyzer tab. The default sample rate is 1 hertz. The plots and frequencies update to use the sample rate.

The Level Selection pane shows the relative energies of the signal across scales, as well as the frequency bands.
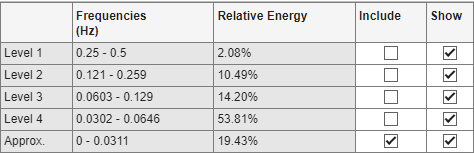
A check box in the Show column controls whether or not that level is displayed in the Decomposition pane. A check box in the Include column controls whether or not to include that level of the wavelet decomposition in the reconstruction. Clicking a plot in the Decomposition pane is another way to include or exclude that level in the signal reconstruction.
To generate a new decomposition, change one of the wavelet parameters in the toolstrip on the MODWT tab and click Decompose.
Wavelet - Wavelet family
Number - Wavelet filter number
Level - Wavelet decomposition level
Changing any parameter in the toolstrip enables the Decompose button.
See Also
Apps
Functions
Related Examples
- Compare MODWTMRA and EMD Decompositions
- Share Results Using Signal Multiresolution Analyzer
- Visualize and Recreate EWT Decomposition
- Visualize and Recreate TQWT Decomposition
- Visualize and Recreate VMD Decomposition
More About
You can also select a web site from the following list:
Americas
- América Latina (Español)
- Canada (English)
- United States (English)
Europe
- Belgium (English)
- Denmark (English)
- Deutschland (Deutsch)
- España (Español)
- Finland (English)
- France (Français)
- Ireland (English)
- Italia (Italiano)
- Luxembourg (English)
- Netherlands (English)
- Norway (English)
- Österreich (Deutsch)
- Portugal (English)
- Sweden (English)
- Switzerland
- United Kingdom (English)