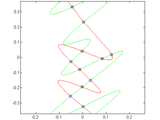
Fast computation of intersections and self-intersections of curves using vectorization.
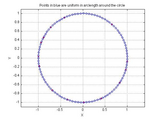
Distance based interpolation along a general curve in space
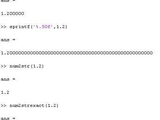
num2strexact does exact conversion of number to string based on IEEE floating point bit pattern

Computes intersection points of two curves.
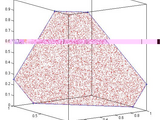
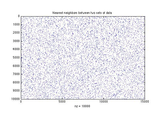
Randomly and uniformly generates vectors with a specified sum and values in a specified interval.

Splits an array of any dimension into cell array of equal sized chunks.
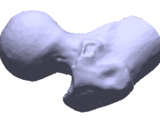
STLREAD imports geometry from a binary stereolithography (STL) file into MATLAB.
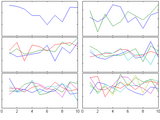
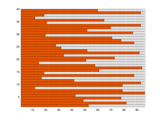
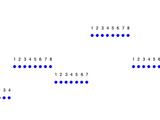
Fills the figure with axes subplots with easily adjustable margins and gaps between the axes.
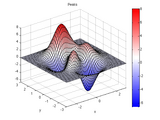
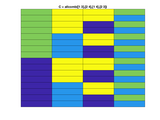
A colormap from bright blue, through white, and then to bright red.
Turns the mouse into a pop-up magnifying glass to look at details of 2D plots.
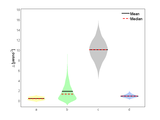
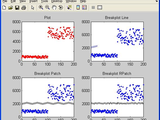
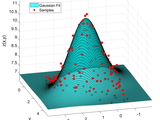
Violin Plot based on kernel density estimation, using default ksdensity
All combinations of input (v4.2, apr 2018)
Shapiro-Wilk & Shapiro-Francia parametric hypothesis test of composite normality.
Extra colormaps for plotting. Contains diverging, sequential, categorical, and perceptual maps.
Easily extract crash logs generated by MATLAB
concatenate vectors with different lengths by padding with NaN
Efficiently performs separable operations (e.g., sum, mean,prod, min, max,...) on array sub-blocks
Computes/applies rotation about arbitrary 3D line.
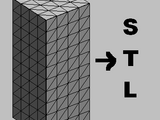
Export a variety of inputs (patch, surface) to an STL triangular mesh
Adds multi-file functionality to functions handling only single files.
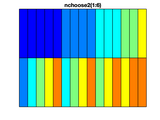
all combinations of two elements
This function displays the IEEE double-precision representation of a double in MATLAB.
An extremely fast implementation of the Hungarian algorithm on a native Matlab code.

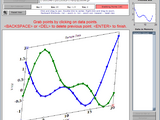
An updated version of Pplane that works on Matlab R2018b
Efficient nonlinear regression fitting using a constrained, partitioned least squares overlay to fmi

Wait a certain time for a single keypress
setFigTransparency sets the transparency/opacity of a figure window, with optional fading effect
The function warps the WIN32 ShowWindow API in User32.dll.
Convert an xml file into a MATLAB structure for easy access to the data.
Check uniqueness of function names
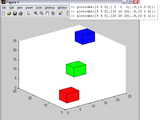
Plot a 3D-cube
Parse a sentence or any string into distinct "words"
Sort strings in natural order.
Produces a plot who's y-axis skips to avoid unnecessary blank space
increases speed of xlswrite function when used in loops or multiple times.
List all partitions of an integer
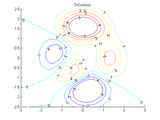
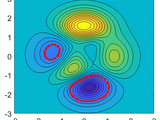
Triangular Contour Plot
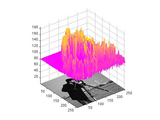
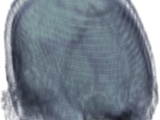
Display a mesh above a grayscale image
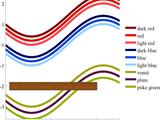
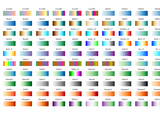
RGB triplets for 949 colors, by how they're perceived on a computer monitor and their common names.
Get a table of contour line coordinates from a contour object.
An efficient and accurate Inter-Point Distance Matrix
Permutations with repetition, all or a subset
GETUNDOC returns a structure of undocumented properties (names & values) for the specified object
POLYPARCI calculates confidence intervals for parameters estimated by ‘polyfit’.
A figure ready to scroll through and play videos. You can also draw any custom graphics on it.
Efficient Random Variates Generator (from over 50 distributions).
3-d volume (voxel) rendering
Compute Multiple Integrals of Orders 4, 5, and 6
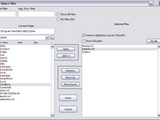
Many-featured, platform independent file and directory picker.
All Pernutations of integers with sum criteria
linear indices for each run in a vector (run length encoding, and decoding)
Write STL file from surface data.
Numeric base conversion between any two numeric bases, for any size integer.
Change the state of a window, like minimize and maximize.
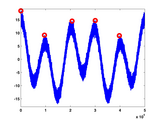
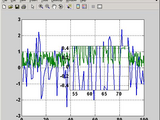
Quickly finds local maxima (peaks) or minima (valleys) in a noisy signal.
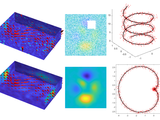
SMOOTHN allows automatized and robust smoothing in arbitrary dimension w/wo missing values
Append data to the next-available row of an existing Excel file with a single call to ActiveX.
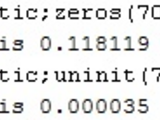
UNINIT is similar to ZEROS, except UNINIT returns uninitialized values instead of zero values.
또한 다음 목록에서 웹사이트를 선택하실 수도 있습니다.
미주
- América Latina (Español)
- Canada (English)
- United States (English)
유럽
- Belgium (English)
- Denmark (English)
- Deutschland (Deutsch)
- España (Español)
- Finland (English)
- France (Français)
- Ireland (English)
- Italia (Italiano)
- Luxembourg (English)
- Netherlands (English)
- Norway (English)
- Österreich (Deutsch)
- Portugal (English)
- Sweden (English)
- Switzerland
- United Kingdom (English)
아시아 태평양
- Australia (English)
- India (English)
- New Zealand (English)
- 中国
- 日本Japanese (日本語)
- 한국Korean (한국어)