'
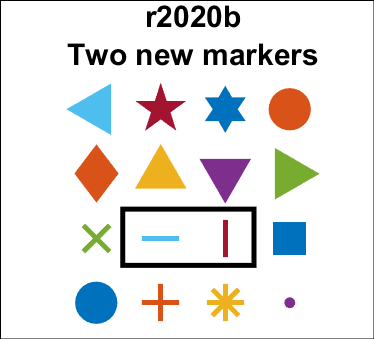
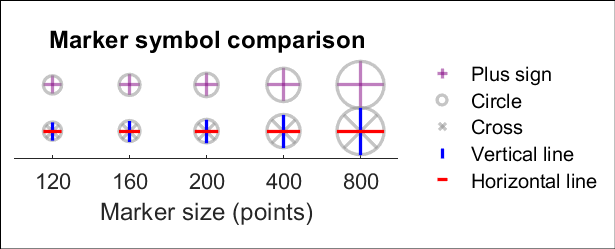
The Matlab r2020b release introduces the new horizontal ('_') and vertical (' | ') line marker symbols that are centered around the coordinate similarly to the plus marker ('+').
plot(x,y,'_')
plot(x,y,'|')
See the attached Live Script to reproduce all plots in this post.
'
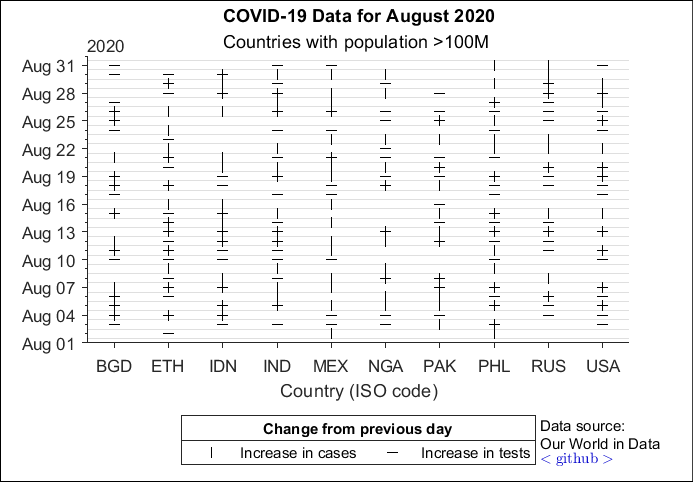
Use case example 1: Days in August 2020 that COVID-19 cases (vertical ticks) and number of tests (horizontal ticks) increased from the previous day in countries with populations greater than 100M (4 countries eliminated for incomplete data).
'
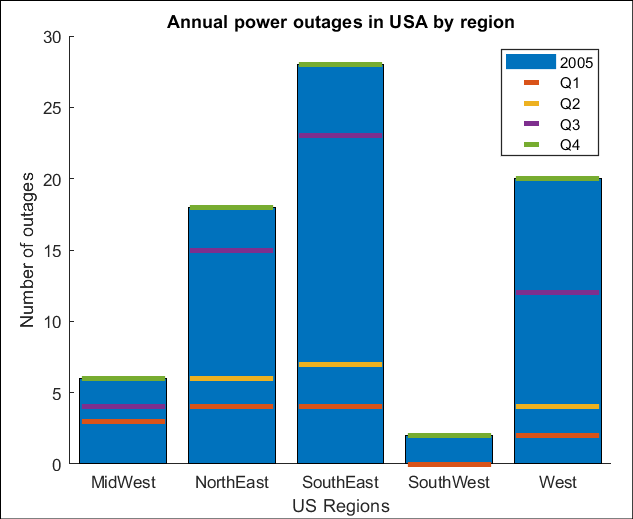
Use case example 2: (An alternative to stacked bar plots) Number of power outages in 2005 across regions of the USA, broken down by calendar quarters.
댓글 수: 2
You explained it perfectly, thank you. You helped me deal with everything
Thanks for pointing this out.
The first graphic that shows the possible markers could be improved. It currently shows the filled circle twice. Also, it doesn't show any of the unfilled shapes, though the second graphic does utilize the unfilled circle.
태그
또한 다음 목록에서 웹사이트를 선택하실 수도 있습니다.
미주
- América Latina (Español)
- Canada (English)
- United States (English)
유럽
- Belgium (English)
- Denmark (English)
- Deutschland (Deutsch)
- España (Español)
- Finland (English)
- France (Français)
- Ireland (English)
- Italia (Italiano)
- Luxembourg (English)
- Netherlands (English)
- Norway (English)
- Österreich (Deutsch)
- Portugal (English)
- Sweden (English)
- Switzerland
- United Kingdom (English)
아시아 태평양
- Australia (English)
- India (English)
- New Zealand (English)
- 中国
- 日本Japanese (日本語)
- 한국Korean (한국어)