See if Answers 460270 whiskers seem incorrect? explanation of what is actually plotted clears up the confusion. I've not done the actual exercise on the doc example but did seem to work for the poster's query there so I'd presume will do so on them as well.
Understanding boxplot whisker thresholds
조회 수: 43 (최근 30일)
이전 댓글 표시
In Matlab's boxplot: the whiskers are calculated as
Upper whisker: q3 + w × (q3 – q1) & Loweer whisker: q1 – w × (q3 – q1). Although
This by design makes the whiskers symmetric. In which case there should be symmetric whiskers everywhere. However their documentation of boxplot (https://www.mathworks.com/help/stats/boxplot.html#bu5f8g7-4) has this:

If one were to assume that the whisker gets capped by the maximum or minimum value in the dataset then a box plot with outliers on top and bottom should have symmetric whiskers. If there are outlier on one side, that side should have the longest whisker.
These should have had equal length but for the left one the bottom whisker is longer( Image is again from box plot documentation).

Also, the below image should have had longer whisker on the side of the outlier.
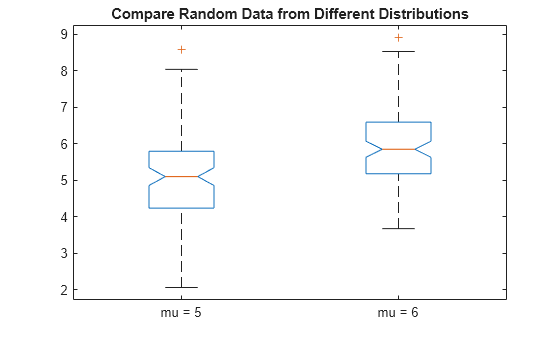
According to here:https://www.mathworks.com/help/stats/box-plots.html
They are implying that the whisker length correspond to the extreme values within the whisker range. Any clarification of their logic in plotting will be helpful.
답변 (0개)
참고 항목
Community Treasure Hunt
Find the treasures in MATLAB Central and discover how the community can help you!
Start Hunting!
Translated by ![]()
또한 다음 목록에서 웹사이트를 선택하실 수도 있습니다.
미주
- América Latina (Español)
- Canada (English)
- United States (English)
유럽
- Belgium (English)
- Denmark (English)
- Deutschland (Deutsch)
- España (Español)
- Finland (English)
- France (Français)
- Ireland (English)
- Italia (Italiano)
- Luxembourg (English)
- Netherlands (English)
- Norway (English)
- Österreich (Deutsch)
- Portugal (English)
- Sweden (English)
- Switzerland
- United Kingdom (English)
아시아 태평양
- Australia (English)
- India (English)
- New Zealand (English)
- 中国
- 日本Japanese (日本語)
- 한국Korean (한국어)