ECG Signal Processing using STMicroelectronics Nucleo Board
This example shows how to use the STM32 Nucleo F767ZI board to process an ECG signal input from an ECG sensor, extract the heart rate in beats per minutes (bpm), and send the ECG signal and heart rate to the ThingSpeak internet of things (IoT) analytics platform service.
Required Hardware
This example requires the following hardware, including:
STM32 F767ZI board
SHIELD-EKG-EMG, data acquisition board
SHIELD-EKG-EMG-PRO, passive electrode for shield
MIKROE-2456, ECG sensor electrodes pack
USB A TO USB MICRO B cables
RJ45 Ethernet cable.
Network Configuration Settings
This example requires a network configuration that includes:
STM32 F767ZI board is connected to the Internet.
Settings in the config set

Required Hardware Connections
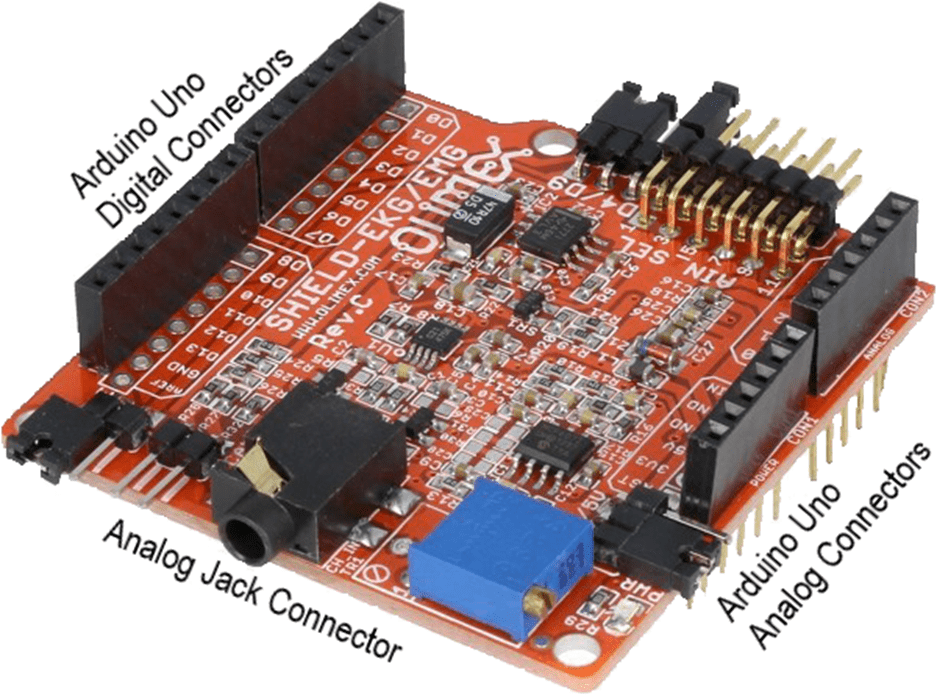
The extension board that is being used for this example is the Shield-EKG-EMG from Olimex. This board has been especially designed, with specific amplifiers and filters, to measure what are called biosignals such as electrocardiogram (ECG) and electromyogram (EMG), which is exactly what is needed for this project as ECG signals are measured.
The Olimex extension board should be connected to the STMF767ZI board via the Arduino Uno connectors. The sensors are three passive electrodes that can be connected to the Shield-EKG-EMG extension board via a jack connector. The electrodes are marked with L for the Left arm, R for the Right arm, and D for the Driven Right Leg (DRL) ground.To measure a correct input signal, the electrodes must be placed on the patient as shown in Olimex Sensor Placement on Patient. After all connection, board appears as shown in Fully Connected System.
STMF767ZI board

Olimex Shield-EKG-EMG Extension Board
Olimex SHIELD-EKG-EMG-PRO Sensors

Olimex Sensor Placement on Patient

Fully Connected System

Understanding the Signal Processing Chain
From a signal processing point of view, an ECG wave is very interesting to study and process, because it is made of both low frequency and high frequency components. In this project, the goal of the application is to extract the heart rate or in other words to determine the distance between two consecutive high frequency R peaks (Normal sinus rhythm impulse).
Normal Sinus Rhythm Impulse

To get the number of beats per minutes (BPM) out of an ECG captured on a patient, a one minute measurement can be done and the high frequency peaks can be manually counted. To speed it up and still have an accurate result, a 30 second measurement can be realized. The sum of the counted peaks is then multiplied by two to get the final BPM value. The goal of the application software is to automate the process measuring the BPM. It first filters the ECG signal to separate and extract the high frequency peaks and then counts the number of peaks and compute the time difference between every pair of consecutive peaks. Based on this, it is then possible to come up with the signal processing chain represented in the block diagram
Signal processing chain to extract the heart rate of an ECG signal

Out of the diagram, it is possible to identify two distinct sections; the first one that goes from the input sensors to the output of the “Lowpass Digital Filter” block, which represents the pre-processing part, and the second section that goes from the input of the “Peaks Extraction” block to the output of the processing chain which represents the post-processing part. The first stage focuses more on filtering the ECG signal and the second one more on computing the needed statistics. The aim of the pre-processing stage is to almost vanish the low frequency components to only keep the high frequency peaks. That is why a “Bandpass Digital Filter” subsystem is used. The coefficients of this filter must be tuned precisely for this first stage to work correctly. The “Rectifier” subsystem is there to get the absolute value of the signal and the “Lowpass Digital Filter” subsystem integrates over the processed signal. The “Pre-emphasis Analog Filter” located on the Olimex extension board (see Olimex Shield-EKG-EMG Extension Board) amplifies the frequency components of interest in the acquired ECG signal to reduce the effect of potential higher ones. The post-processing stage must then distinguish between global maxima representing the high frequency peaks and local maxima that are some remains of the filtering process. This is done by the “Maxima Extraction” subsystem that has a threshold parameter that must be tuned precisely so that the global maxima are identified correctly. Once these maxima have been extracted, the “Desired Time Info” subsystem computes the time difference in seconds between each pair of consecutive peaks and provides results in the desired BPM format.
Sampling frequency
The heart rate values depend on the age and gender of human beings. In general, when there is a normal sinus rhythm, the maximal possible value for an athlete is of220 BPM. In theory, the maximum possible heart rate for a human being is of 300BPM. A value that would be over this theoretical one would mean that the heart is not following a normal sinus rhythm and that the patient life is in severe danger
For application based considerations, it has been decided for this project to have the system being able to measure a heart rate within the range of 0 to 255 BPM. An advantage of this choice is that BPM values can be encoded as unsigned integer of 8 bits. Moreover, if the maximal value of 255 BPM is reached, this highlights the fact that it is abnormal, and the patient needs urgent assistance. Following the Nyquist frequency principle for a digital system, the sampling frequency (FS) of the digital part of the signal processing chain is twice this value as defined in the expression:
FS = 2·255 = 510 Hz
Where the measurement range is [0;255] Hz.
Deploying the Model to the STM Board

Open model
stmnucleo_ECGProcessing.slx.Connect the board to the PC using the USB cable.
Configure the network properties for the model as described in the previous task: Network Configuration Settings.
Open Send to ThingSpeak sub system, open ThingSpeak Write block mask. Provide Channel ID and ThingSpeak Write API Key.
On the model, press Ctrl+B or on the Hardware tab, click Build, Deploy & Start > Build Stand-Alone to build, load and run the model on the target.
Model starts running on the board.
Open your ThingSpeak channel which is configured in the model, you can see the bpm values.
Configure ThingSpeak Visualizations
Use the M script files PlotOneEcgPulse.m and PlotLastEcgSignal.m setup the ECG signals for display on ThingSpeak. See ThingSpeak Channel BMP Charts. Then, in the View of the ThingSpeak Channel, click on “Add Visualizations” and select one of the two charts.
ThingSpeak Channel BMP Charts

View of the ThingSpeak Channel

Add Visualizations

Close the Model and Script Files
When done with simulation. Close all the files.
You can also select a web site from the following list:
Americas
- América Latina (Español)
- Canada (English)
- United States (English)
Europe
- Belgium (English)
- Denmark (English)
- Deutschland (Deutsch)
- España (Español)
- Finland (English)
- France (Français)
- Ireland (English)
- Italia (Italiano)
- Luxembourg (English)
- Netherlands (English)
- Norway (English)
- Österreich (Deutsch)
- Portugal (English)
- Sweden (English)
- Switzerland
- United Kingdom (English)