Create and Customize Android Application Dashboard for Audio Visualizer
This example shows how to create and customize an Android® application to add reverberation effects to a real-time audio signal. You can customize the application dashboard to suit your requirement and functional area.
Introduction
In this example, an application is deployed on an Android device, such as phone or tablet, with a graphical user interface (GUI) to add reverberation effects to a real-time audio signal. The application displays an audio visualizer whose dashboard uses various user-interactive knobs and slider switches that correspond to its parameters used in the Simulink® model. The application can be customized to display various knobs and slider switches.
Note: This example shows you how to create and custom design a dashboard interface for the audio visualizer Android application. For more information on the various audio visualizer parameters, refer to the Description of the Model section in the Add Echo and Reverberation Effects to an Audio Signal on an Android Device example. The Simulink model used in this example does not use the Data Visualizer subsystem.
Prerequisites
We recommend that you complete the Getting Started with Android Devices example.
Required Products
Required Hardware
Android device such as a phone or a tablet
Micro USB cable
Headphones with built-in speakers (recommended)
Task 1: Configure Model
This support package provides a preconfigured model that consists of two dashboard panels for controlling the audio visualizer parameters.
1. Open the androidAudioDashboard Simulink model.

2. Connect the Android device to the host computer using the micro USB cable.
3. On the Modeling tab of the toolstrip, select Model Settings.
4. In the Configuration Parameters dialog box, select Hardware Implementation. Verify that the Hardware board parameter is set to Android Device.
5. From the Groups list under Target hardware resources, select Device options.
6. From the Device list, select your Android device. If your device is not listed, click Refresh.
Note: If your device is not listed even after clicking Refresh, ensure that you have enabled the USB debugging option on your device. To enable USB debugging, enter androidhwsetup in the MATLAB® Command Window and follow the onscreen instructions.
The Simulink model consists of two panels to tune and control the audio visualizer parameters. These panels are collapsible. Double-click the panel to view them.
1. First panel:
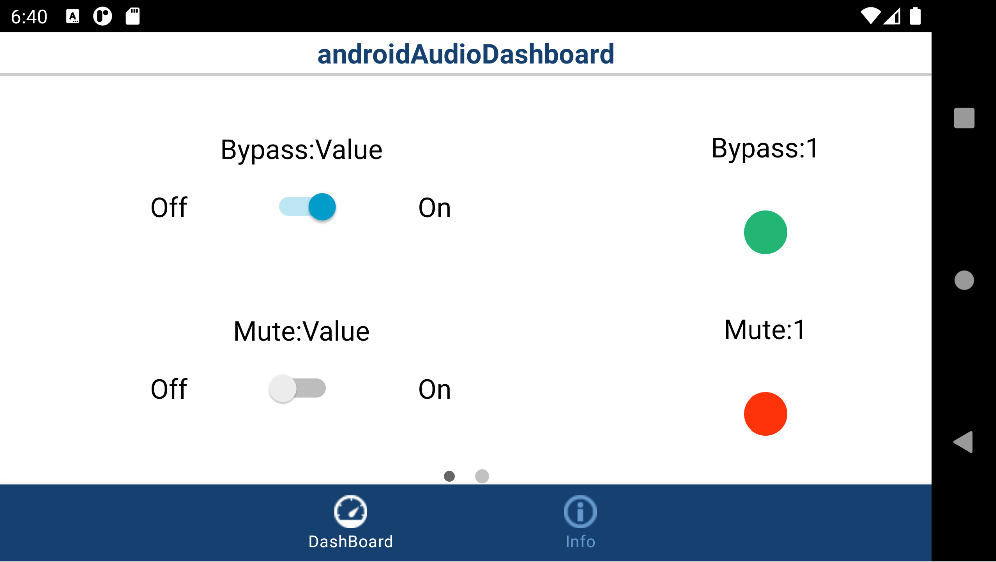
Bypass: Hear the original audio signal. A Bypass lamp displays the status of the Bypass slider switch. The default position is
On.Mute: Mute the audio signal. A Mute lamp displays the status of the Mute slider switch. The default position is
Off.
2. Second panel:
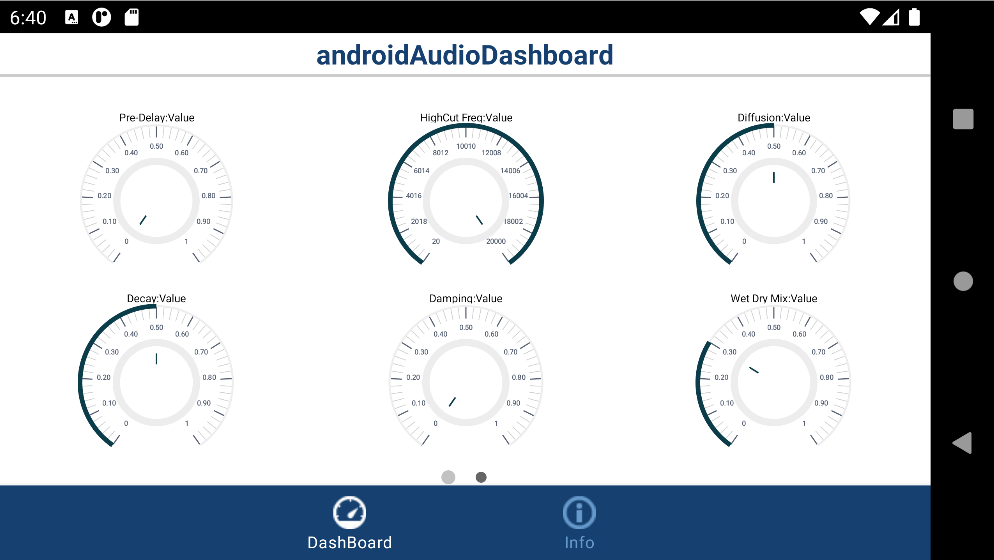
Pre-Delay: Time between hearing the direct audio signal and the first early reflection.
HighCut Freq: Cut-off frequency for the lowpass filter at the front of the reverberator structure.
Diffusion: Density of the reverberation tail.
Decay: Decay factor of the reverberation tail.
Damping: Attenuation of high frequencies in the reverberation output.
Wet Dry Mix: Ratio of wet signal added to the dry audio signal.
Task 2: Run Model on Android Device
The number of panels created in the Simulink model determine the number of pages created in the dashboard of the Android application. In this example, two panels create two pages in the dashboard. Each knob and slider switch corresponds to the parameters of the audio visualizer. You can arrange the position of these knobs and slider switches and decide on the number of panels to suit your functional area and requirements. The application continues to run even if the device is disconnected from the host computer.
1. On the Hardware tab of the Simulink model, in the Mode section, select Run on board and then click Build, Deploy & Start to build and deploy the model on the Android device. The androidAudioDashboard application launches automatically.
2. Start speaking through the microphone. We recommend that you use a headset to reduce the feedback loop between the microphone and the speaker.
3. Change the position of the knobs and slider switches and observe the corresponding reverberation effects in the audio signal while you continue to speak.
Android Application Dashboard Corresponding to First Panel
Android Application Dashboard Corresponding to Second Panel
androidAudioDashboard Application
The androidAudioDashboard application has two sections:
Dashboard: The position of the knobs and slider switches corresponding to the various audio visualizer parameters are preconfigured to a default value. The number of panels created in the Simulink model correspond to the number of pages in the Dashboard page of the application.
Info: This section provides details such as IP address of the connected Android device, the device serial number, and the name of the model deployed on the Android device.
Other Things to try
You can create a new panel by using the existing knobs and slider switches from the preconfigured Simulink model.
Click on the panel pane. Notice the three dots on top of the panel.
Click Edit Panel. The panel is now editable and you can decide the number of knobs and slider switches you want on one panel.
Select and drag the knob or slider switch and select Done Editing.
Click on the knob or slider switch that you selected in the previous step. Notice the three dots on top of it.
Select Promote to Panel. A new panel will be created around the knob or slider switch.
You can expand the panel size only in the edit mode to fit in all the knobs and slider switches in the panel that correspond to a page on the Android application.
You can also create a panel by adding new knobs or slider switches in the Simulink model to suit your functional requirement.
Select a Knob or Slider Switch from the Simulink Library > Dashboard.
Double-click the knob or slider switch to open the Block Parameters dialog box. Connect the knob or the slider switch to the audio visualizer parameters. For more information on how to make a connection to the block parameters and configure them, refer to Knob and Slider Switch. Note the name of the audio visualizer parameters on top of the knob or slider switch once the connection is made.
Click on the knob or slider switch and notice the three dots on top of it.
Select Promote to Panel. A new panel will be created around the knob or slider switch.
You can expand the panel size only in the edit mode to fit in all the knobs and slider switches in the panel that correspond to a page on the Android application.
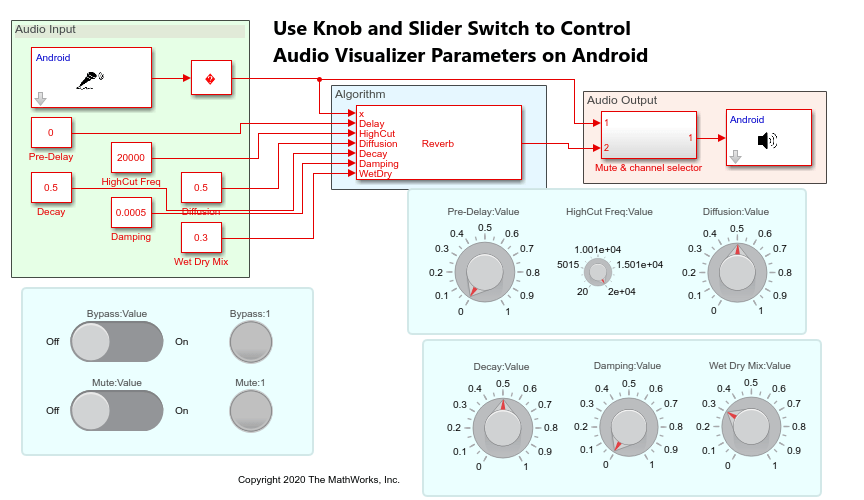
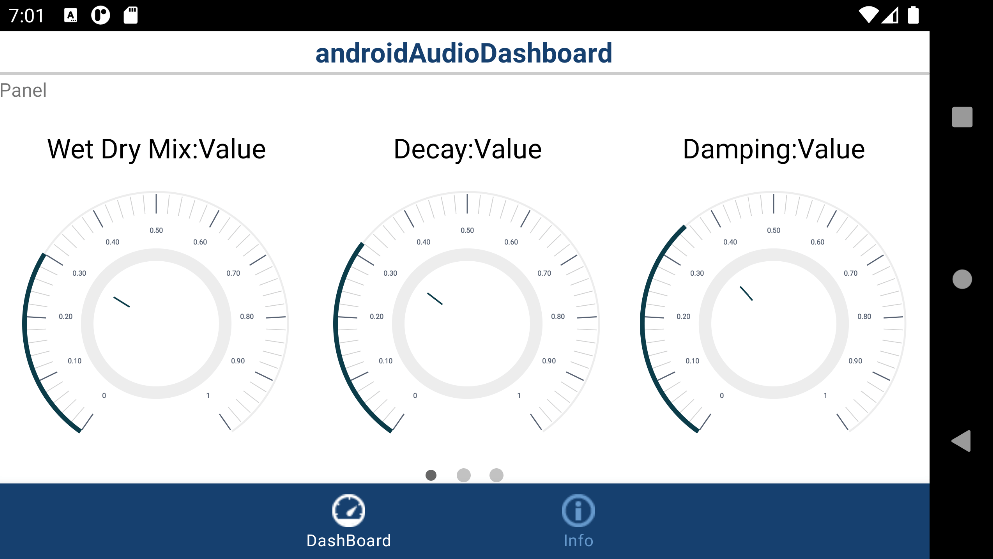
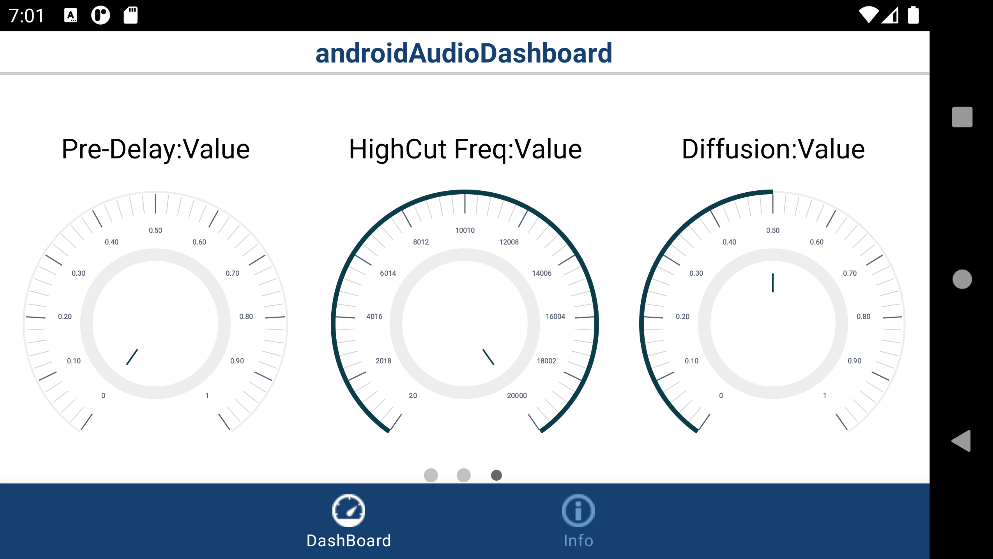
As an example, to showcase how the panels can be customized, three dashboard panels are created. In the first panel, Bypass and Mute switches are utilized. In the second panel, Pre-Delay, HighCut Freq, and Diffusion knobs are utilized. In the third panel, Decay, Damping, and Wet Dry Mix knobs are utilized.
androidAudioDashboard Simulink Model Configured for Three Dashboard Panels
Android Application Dashboard Corresponding to First Panel
Android Application Dashboard Corresponding to Second Panel

Android Application Dashboard Corresponding to Third Panel
Related Links
See Also
You can also select a web site from the following list:
Americas
- América Latina (Español)
- Canada (English)
- United States (English)
Europe
- Belgium (English)
- Denmark (English)
- Deutschland (Deutsch)
- España (Español)
- Finland (English)
- France (Français)
- Ireland (English)
- Italia (Italiano)
- Luxembourg (English)
- Netherlands (English)
- Norway (English)
- Österreich (Deutsch)
- Portugal (English)
- Sweden (English)
- Switzerland
- United Kingdom (English)