Performance Report
Display performance and core usage metrics after model simulation or execution on SoC device
Since R2021b
Description
The Performance Report app displays summaries of task executions, core usage of the processor, and memory performance diagnostics. You can use the report after model simulation or after execution on a hardware processor.
This app displays the following information:
Task Activity
When the design includes a Task Manager block, you can view the following information for each task:
Total executions per task
Minimum, mean, maximum, and standard deviation (SD) of execution times per task
Minimum, mean, and maximum turnaround times per task
Total and percentage of dropped task instances
Total and percentage of overrun task instances
Task distribution per processor core
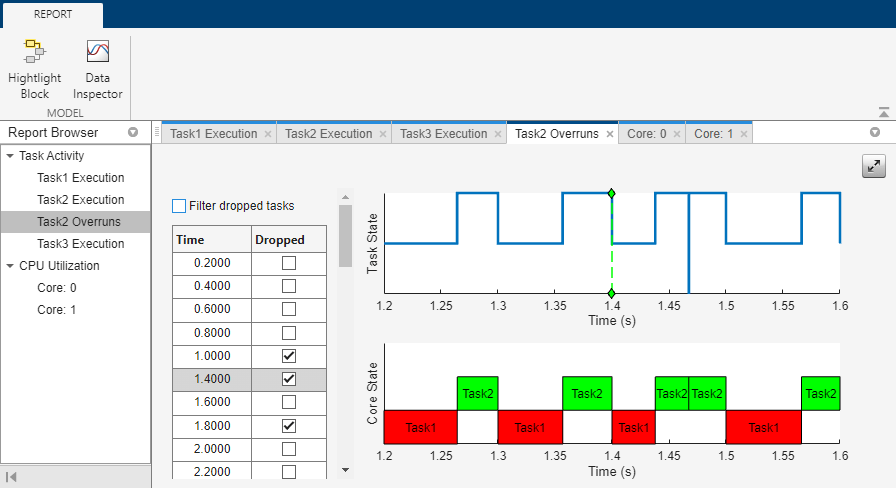
You can also select a view of task overruns, which has these features:
Time instance when the task should have run
Indication if the task overrun resulted in a task drop
Filter switch to Show only dropped tasks for a more focused analysis
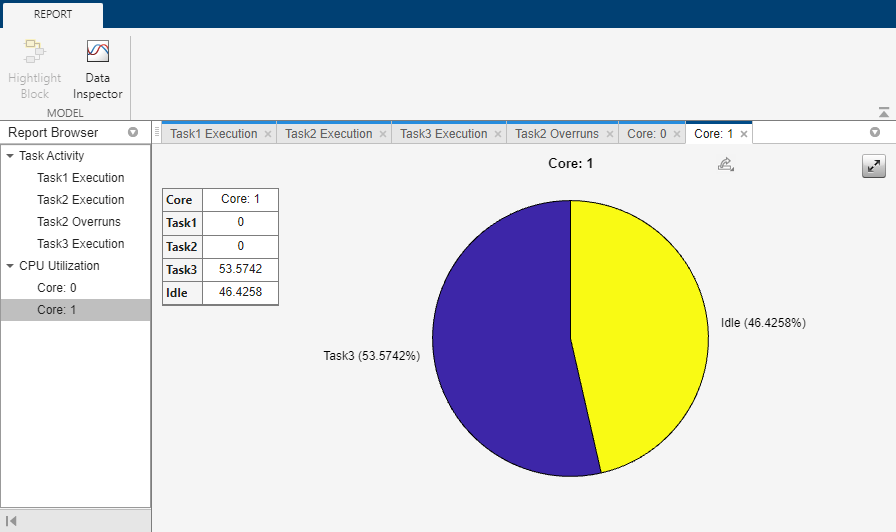
CPU Utilization Per Core
Active time for each task
Core idle time
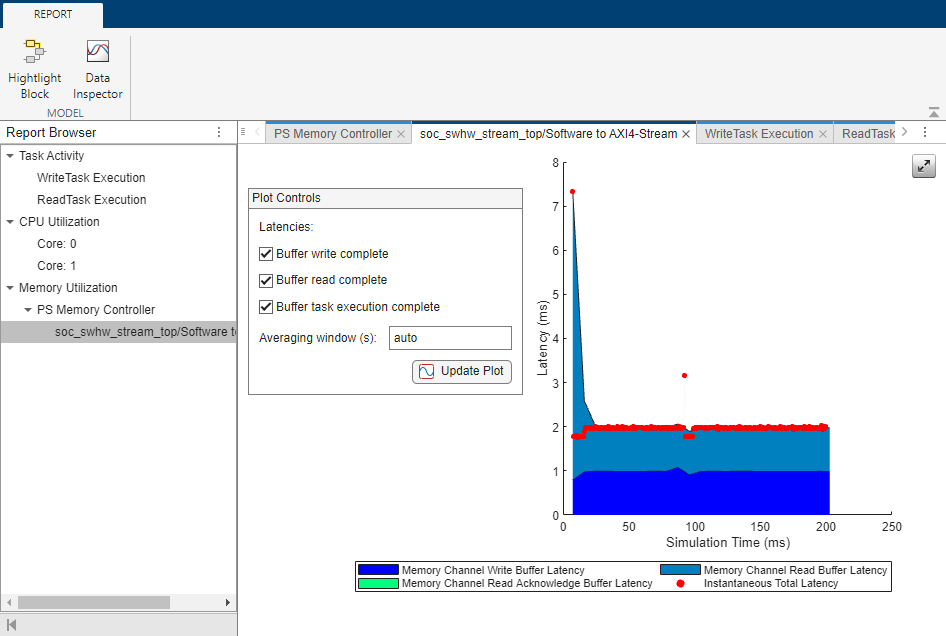
Memory Utilization
If memory logging is enabled, and the design includes a Memory Controller block with one of these memory channel blocks:
You can view the following information for each memory channel:
Bandwidth, burst, and latency information per Memory Controller block.
Completion of buffer read or write
Completion of task execution
To enable memory logging, select Hardware Settings in the toolstrip. Then, select Hardware Implementation > Target hardware resources > FPGA design (debug) and then:
Set Memory diagnostics level to
Basic diagnostic signals.Select Include AXI interconnect monitor.
Interprocess Data Channel Statistics
When an Interprocess Data Channel, Interprocess Data Read, or Interprocess Data Write block is in the design, you can view the following information for each interprocess data channel:
Block name
Number of buffers
Maximum number of buffers used
Total overwritten buffers
The memory utilization plots are calculated measurements from a simulation of your model. The plots consider the data type, sample time, and clock frequency to calculate the bandwidth of your memory model and considers the number of bursts executed per memory port.
Open the Performance Report
Simulink® Toolstrip: On the System on Chip tab, click Performance Report.
Examples
Performance Report for SoC Model
View the execution data for an SoC Blockset model using the Performance Report app. The task_execution_report_top_model model contains three timer-driven tasks that execute over two processor cores. Run the model.
load_system('task_execution_report_top_model.slx');
sim('task_execution_report_top_model');
Open the Performance Report app by clicking Performance Report on the System on Chip tab. Navigate the left pane to view task activity, CPU utilization, or memory utilization. For each task, the app shows the summary of data, including the execution time, turnaround time, dropped tasks, and task overrun. The app also shows the usage statistics for each processor core. This figure shows the app with information for task 1 and task 2 displayed side by side:

In this case, the table shows that task 1 and task 2 compete for resources on core 0. Task 2, the lower priority task, gets dropped 30% of the time with 98% overrun. Examine the overruns by clicking Task2 Overruns on the left pane.
View a histogram of the task execution over the course of a simulation or hardware execution. To view the histogram, click a task and select Show Histogram. This figure shows the execution time of task 1.

View a pie chart of the core utilization over the course of a simulation by clicking Core:1 on the left pane.
Related Examples
Version History
Introduced in R2021bYou can also select a web site from the following list:
Americas
- América Latina (Español)
- Canada (English)
- United States (English)
Europe
- Belgium (English)
- Denmark (English)
- Deutschland (Deutsch)
- España (Español)
- Finland (English)
- France (Français)
- Ireland (English)
- Italia (Italiano)
- Luxembourg (English)
- Netherlands (English)
- Norway (English)
- Österreich (Deutsch)
- Portugal (English)
- Sweden (English)
- Switzerland
- United Kingdom (English)