Robustness of Servo Controller for DC Motor
This example shows how to use uncertain objects in Robust Control Toolbox™ to model uncertain systems and assess robust stability and robust performance using the robustness analysis tools.
Data Structures for Uncertainty Modeling
Robust Control Toolbox lets you create uncertain elements, such as physical parameters whose values are not known exactly, and combine these elements into uncertain models. You can then easily analyze the impact of uncertainty on the control system performance.
For example, consider a plant model
where gamma can range in the interval [3,5] and tau has average value 0.5 with 30% variability. You can create an uncertain model of P(s) as in this example:
gamma = ureal('gamma',4,'range',[3 5]);
tau = ureal('tau',.5,'Percentage',30);
P = tf(gamma,[tau 1])
Uncertain continuous-time state-space model with 1 outputs, 1 inputs, 1 states.
The model uncertainty consists of the following blocks:
  gamma: Uncertain real, nominal = 4, range = [3,5], 1 occurrences
  tau: Uncertain real, nominal = 0.5, variability = [-30,30]%, 1 occurrences

Type "P.NominalValue" to see the nominal value and "P.Uncertainty" to interact with the uncertain elements.
Suppose you have designed an integral controller C for the nominal plant (gamma=4 and tau=0.5). To find out how variations of gamma and tau affect the plant and the closed-loop performance, form the closed-loop system CLP from C and P.
KI = 1/(2*tau.Nominal*gamma.Nominal);
C = tf(KI,[1 0]);
CLP = feedback(P*C,1)
Uncertain continuous-time state-space model with 1 outputs, 1 inputs, 2 states.
The model uncertainty consists of the following blocks:
  gamma: Uncertain real, nominal = 4, range = [3,5], 1 occurrences
  tau: Uncertain real, nominal = 0.5, variability = [-30,30]%, 1 occurrences

Type "CLP.NominalValue" to see the nominal value and "CLP.Uncertainty" to interact with the uncertain elements.
Plot the step response of the plant and closed-loop system. The step command automatically generates 20 random samples of the uncertain parameters gamma and tau and plots the corresponding step responses.
subplot(2,1,1); step(P), title('Plant response (20 samples)')
subplot(2,1,2); step(CLP), title('Closed-loop response (20 samples)')
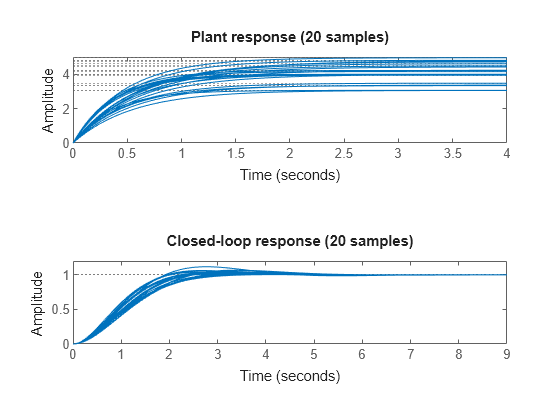
Figure 1: Step responses of the plant and closed-loop models
The bottom plot shows that the closed-loop system is reasonably robust despite significant fluctuations in the plant DC gain. This is a desirable and common characteristic of a properly designed feedback system.
DC Motor Example with Parameter Uncertainty and Unmodeled Dynamics
This example builds on the example Reference Tracking of DC Motor with Parameter Variations by adding parameter uncertainty and unmodeled dynamics, to investigate the robustness of the servo controller to such uncertainty.
The nominal model of the DC motor is defined by the resistance R, the inductance L, the emf constant Kb, armature constant Km, the linear approximation of viscous friction Kf and the inertial load J. Each of these components varies within a specific range of values. The resistance and inductance constants range within ±40% of their nominal values. Use ureal to construct these uncertain parameters.
R = ureal('R',2,'Percentage',40);
L = ureal('L',0.5,'Percentage',40);
For physical reasons, the values of Kf and Kb are the same, even if they are uncertain. In this example, the nominal value is 0.015 with a range between 0.012 and 0.019.
K = ureal('K',0.015,'Range',[0.012 0.019]);
Km = K;
Kb = K;
Viscous friction, Kf, has a nominal value of 0.2 with a 50% variation in its value.
Kf = ureal('Kf',0.2,'Percentage',50);
Electrical and Mechanical Equations
The current in the electrical circuit, and the torque applied to the rotor can be expressed in terms of the applied voltage and the angular speed. Create the transfer function H relating these variables, and make AngularSpeed an output of H for later use.
H = [1;0;Km] * tf(1,[L R]) * [1 -Kb] + [0 0;0 1;0 -Kf];
H.InputName = {'AppliedVoltage';'AngularSpeed'};
H.OutputName = {'Current';'AngularSpeed';'RotorTorque'};
The motor typically drives an inertia, whose dynamic characteristics relate the applied torque to the rate-of-change of the angular speed. For a rigid body, this value is a constant. A more realistic, but uncertain, model might contain unknown damped resonances. Use the ultidyn object to model uncertain linear time-invariant dynamics. Set the nominal value of the rigid body inertia to 0.02 and we include 15% dynamic uncertainty in multiplicative form.
J = 0.02*(1 + ultidyn('Jlti',[1 1],'Type','GainBounded','Bound',0.15,...
   'SampleStateDim',4));
Uncertain Model of DC Motor
It is a simple matter to relate the AngularSpeed input to the RotorTorque output through the uncertain inertia, J, using the lft command. The AngularSpeed input equals RotorTorque/(J*s). Therefore, use "positive" feedback from the third output to the second input of H to make the connection. This connection results in a system with one input (AppliedVoltage) and two outputs (Current and AngularSpeed).
Pall = lft(H,tf(1,[1 0])/J);
Select only the AngularSpeed output for the remainder of the control analysis.
P = Pall(2,:)
Uncertain continuous-time state-space model with 1 outputs, 1 inputs, 2 states.
The model uncertainty consists of the following blocks:
  Jlti: Uncertain 1x1 LTI, peak gain = 0.15, 1 occurrences
  K: Uncertain real, nominal = 0.015, range = [0.012,0.019], 2 occurrences
  Kf: Uncertain real, nominal = 0.2, variability = [-50,50]%, 1 occurrences
  L: Uncertain real, nominal = 0.5, variability = [-40,40]%, 1 occurrences
  R: Uncertain real, nominal = 2, variability = [-40,40]%, 1 occurrences

Type "P.NominalValue" to see the nominal value and "P.Uncertainty" to interact with the uncertain elements.
P is a single-input, single-output uncertain model of the DC motor. For analysis purposes, use the following controller.
Cont = tf(84*[.233 1],[.0357 1 0]);
Open-Loop Analysis
First, compare the step response of the nominal DC motor with 15 samples of the uncertain model of the DC motor. Use usample to explicitly specify the number of random samples.
clf
step(usample(P,15),P.NominalValue,3)
legend('Samples','Nominal')
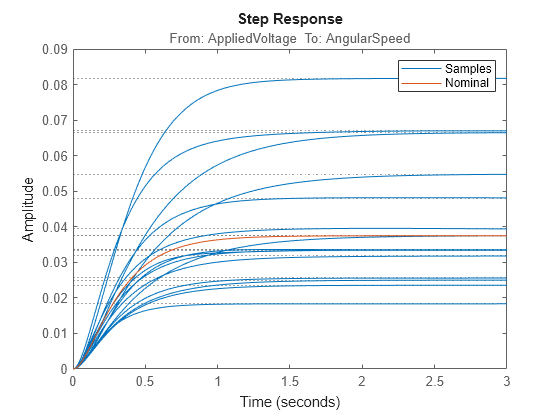
Figure 2: Plant step response
Similarly, compare the Bode response of the nominal (red) and sampled (blue) uncertain models of the DC motor.
bode(usample(P,15),P.NominalValue);
legend('Samples','Nominal')
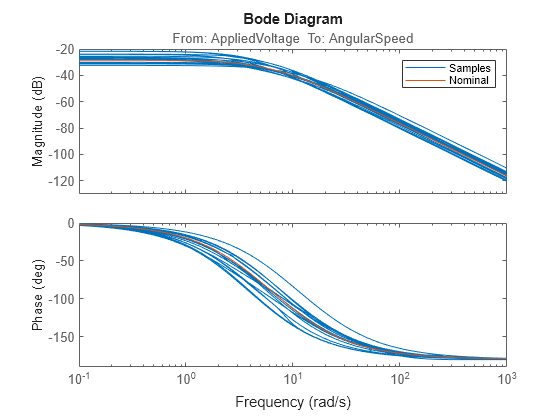
Figure 3: Plant Bode response
Robustness Analysis
In this section, analyze the robustness of the DC motor controller. A nominal analysis of the closed-loop system indicates the feedback loop is very robust with 22 dB gain margin and 66 deg of phase margin.
margin(P.NominalValue*Cont)
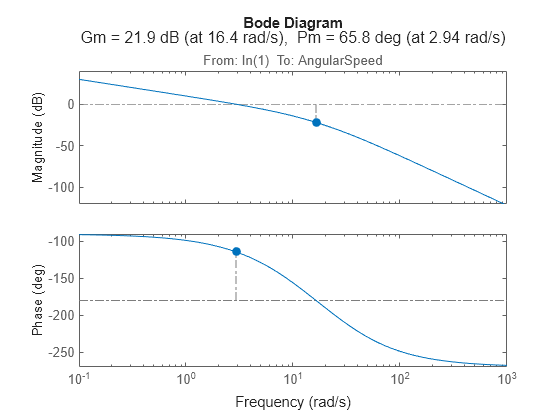
Figure 4: Closed-loop robustness analysis
The diskmargin function computes the disk-based gain and phase margins. By modeling gain and phase variations at all frequencies and in all feedback loops, disk margins tend to be more accurate estimates of robustness, especially in multi-loop control systems. Compute the disk-based margins for the DC motor loop.
DM = diskmargin(P.NominalValue*Cont)
DM = struct with fields:
           GainMargin: [0.2792 3.5822]
          PhaseMargin: [-58.8054 58.8054]
           DiskMargin: 1.1271
           LowerBound: 1.1271
           UpperBound: 1.1271
            Frequency: 5.0062
    WorstPerturbation: [1x1 ss]
While smaller than the classical gain and phase margins, the disk-based margins essentially confirm that the nominal feedback loop is very robust. Now, recall that the DC motor plant is uncertain. How does the modeled uncertainty affect these stability margins? For quick insight, plot the disk-based gain and phase margins for 20 samples of the uncertain open-loop response.
diskmarginplot(P*Cont,P.NominalValue*Cont)
legend('Samples','Nominal')
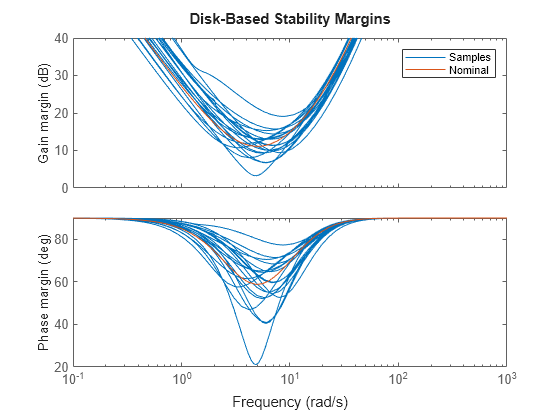
Some combinations of plant uncertainty lead to smaller margins. The plot shows only a small sample. Use worst-case analysis to find out how bad the margins can really get. The wcdiskmargin function directly computes the worst-case gain and phase margins for the modeled uncertainty.
wcDM = wcdiskmargin(P*Cont,'siso')wcDM = struct with fields:
GainMargin: [0.8728 1.1457]
PhaseMargin: [-7.7680 7.7680]
DiskMargin: 0.1358
LowerBound: 0.1358
UpperBound: 0.1361
CriticalFrequency: 4.9846
WorstPerturbation: [1x1 ss]
mag2db(wcDM.GainMargin)
ans = 1×2

   -1.1812    1.1812
Here the worst-case margins are only 1.2 dB and 7.8 degrees, signaling that the closed loop is nearly unstable for some combinations of the uncertain elements.
Robustness of Disturbance Rejection Characteristics
The sensitivity function is a standard measure of closed-loop performance for the feedback system. Compute the uncertain sensitivity function S and compare the Bode magnitude plots for the nominal and sampled uncertain sensitivity functions.
S = feedback(1,P*Cont);
bodemag(S,S.Nominal)
legend('Samples','Nominal')
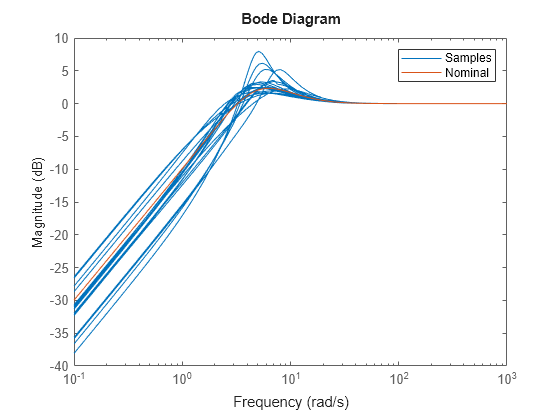
Figure 5: Magnitude of sensitivity function S.
In the time domain, the sensitivity function indicates how well a step disturbance can be rejected. Plot its step response to see the variability in disturbance rejection characteristics (nominal appears in red).
step(S,S.Nominal)
title('Disturbance Rejection')
legend('Samples','Nominal')

Figure 6: Rejection of a step disturbance.
Use the wcgain function to compute the worst-case value of the peak gain of the sensitivity function.
[maxgain,worstuncertainty] = wcgain(S);
maxgain
maxgain = struct with fields:
           LowerBound: 7.5195
           UpperBound: 7.5356
    CriticalFrequency: 4.9971
With the usubs function you can substitute the worst-case values of the uncertain elements into the uncertain sensitivity function S. This gives the worst-case sensitivity function Sworst over the entire uncertainty range. Note that the peak gain of Sworst matches the lower-bound computed by wcgain.
Sworst = usubs(S,worstuncertainty);
norm(Sworst,inf)
ans = 7.5195
maxgain.LowerBound
ans = 7.5195
Now compare the step responses of the nominal and worst-case sensitivity.
step(Sworst,S.NominalValue,6);
title('Disturbance Rejection')
legend('Worst-case','Nominal')

Figure 7: Nominal and worst-case rejection of a step disturbance
Clearly some combinations of uncertain elements significantly degrade the ability of the controller to quickly reject disturbances. Finally, plot the magnitude of the nominal and worst-case values of the sensitivity function. Observe that the peak value of Sworst occurs at the frequency maxgain.CriticalFrequency:
bodemag(Sworst,S.NominalValue)
legend('Worst-case','Nominal')
hold on
semilogx(maxgain.CriticalFrequency,20*log10(maxgain.LowerBound),'g*')

Figure 8: Magnitude of nominal and worst-case sensitivity
See Also
diskmargin | wcgain | uss | usubs
Related Topics
You can also select a web site from the following list:
Americas
- América Latina (Español)
- Canada (English)
- United States (English)
Europe
- Belgium (English)
- Denmark (English)
- Deutschland (Deutsch)
- España (Español)
- Finland (English)
- France (Français)
- Ireland (English)
- Italia (Italiano)
- Luxembourg (English)
- Netherlands (English)
- Norway (English)
- Österreich (Deutsch)
- Portugal (English)
- Sweden (English)
- Switzerland
- United Kingdom (English)