Use newplot to Control Plotting
This example shows how to prepare figures and axes for user-written plotting functions. Use dot notation to set properties.
Use newplot to manage the output from
specialized plotting functions. The myPlot2D function:
Customizes the axes and figure appearance for a particular publication requirement.
Uses revolving line styles and a single color for multiline graphs.
Adds a legend with specified display names.
function myPlot2D(x,y)
   % Call newplot to get the axes handle
   cax = newplot;
   % Customize axes
   cax.FontName = 'Times';
   cax.FontAngle = 'italic';
   % Customize figure
   fig = cax.Parent;
   fig.MenuBar= 'none';
   % Call plotting commands to
   % produce custom graph
   hLines = line(x,y,...
      'Color',[.5,.5,.5],...
      'LineWidth',2);
   lso = ['- ';'--';': ';'-.'];
   setLineStyle(hLines)
   grid on
   legend('show','Location','SouthEast')
   function setLineStyle(hLines)
      style = 1;
      for ii = 1:length(hLines)
         if style > length(lso)
            style = 1;
         end
         hLines(ii).LineStyle = lso(style,:);
         hLines(ii).DisplayName = num2str(style);
         style = style + 1;
      end
   end
end
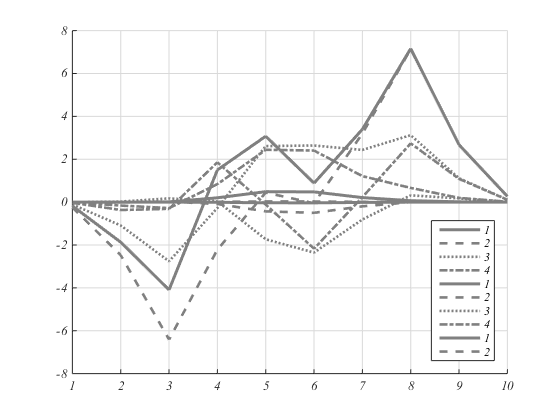
This graph shows typical output for the myPlot2D function:
x = 1:10;
y = peaks(10);
myPlot2D(x,y)
The myPlot2D function shows the basic structure of a user-written
plotting functions:
Call
newplotto get the handle of the target axes and to apply the settings of theNextPlotproperties of the axes and figure.Use the returned axes handle to customize the axes or figure for this specific plotting function.
Call plotting functions (for example,
lineandlegend) to implement the specialized graph.
Because myPlot2D uses the handle returned by
newplot to access the target figure and axes, this function:
Adheres to the behavior of MATLAB® plotting functions when clearing the axes with each subsequent call.
Works correctly when
holdis set toon
The default settings for the NextPlot properties ensure that your
plotting functions adhere to the standard MATLAB behavior — reuse the figure window, but clear and reset the axes with
each new graph.
You can also select a web site from the following list:
Americas
- América Latina (Español)
- Canada (English)
- United States (English)
Europe
- Belgium (English)
- Denmark (English)
- Deutschland (Deutsch)
- España (Español)
- Finland (English)
- France (Français)
- Ireland (English)
- Italia (Italiano)
- Luxembourg (English)
- Netherlands (English)
- Norway (English)
- Österreich (Deutsch)
- Portugal (English)
- Sweden (English)
- Switzerland
- United Kingdom (English)