zerophase
Zero-phase response of discrete-time filter System object
Syntax
Description
Examples
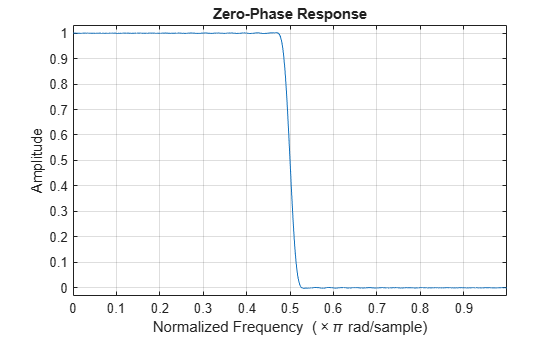
Zero-phase Response of Discrete-Time Filter
Create a dsp.FIRFilter System object™ and compute the zero-phase response of the filter.
Fs = 8000;
Fcutoff = 2000;
FIRFilt = dsp.FIRFilter(Numerator=designLowpassFIR(FilterOrder=130,...
    CutoffFrequency=Fcutoff/(Fs/2)));
The zerophase function computes and plots the zero-phase response of the filter.
zerophase(FIRFilt)
Input Arguments
Output Arguments
Version History
Introduced in R2011aYou can also select a web site from the following list:
Americas
- América Latina (Español)
- Canada (English)
- United States (English)
Europe
- Belgium (English)
- Denmark (English)
- Deutschland (Deutsch)
- España (Español)
- Finland (English)
- France (Français)
- Ireland (English)
- Italia (Italiano)
- Luxembourg (English)
- Netherlands (English)
- Norway (English)
- Österreich (Deutsch)
- Portugal (English)
- Sweden (English)
- Switzerland
- United Kingdom (English)