pattern
Plot radiation pattern and phase of antenna or array or embedded pattern of antenna element in array
Syntax
Description
pattern(
plots the 3-D radiation pattern of the antenna or array object over a specified frequency.
By default, in Antenna Toolbox™, the far-field radius is set to object,frequency)100λ. For a detailed
explanation of field calculation of antennas, see Field Calculation in Antennas.
pattern(___, uses
additional options specified by one or more name-value arguments. You can use any of the
input arguments from previous syntaxes.Name=Value)
Use the ElementNumber and Termination property
to calculate the embedded pattern of the antenna element in an array connected to a
voltage source. The voltage source model consists of an ideal voltage source of 1 volt in
series with a source impedance. The embedded pattern includes the effect of mutual
coupling due to the other antenna elements in the array.
[ uses additional
options specified by one or more name-value arguments.pat,azimuth,elevation]
= pattern(___,Name=Value)
Examples
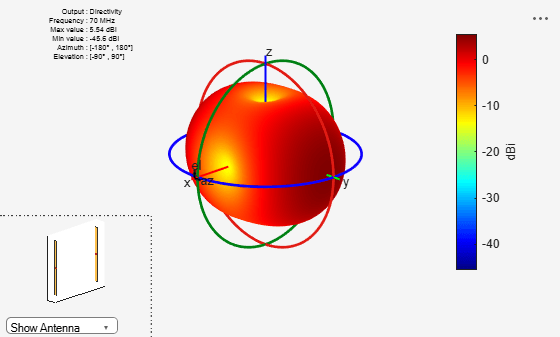
Calculate Radiation Pattern of Array
Calculate radiation pattern of default linear array for a frequency of 70 MHZ.
l = linearArray;
pattern(l,70e6)
Radiation Pattern of Helix in X-Z Plane
Plot the radiation pattern of a helix antenna in xz-plane.
h = helix;
pattern (h, 2e9, 0, 1:1:360);
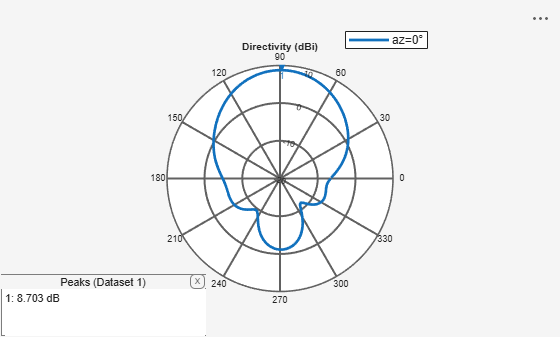
[pat,azimuth,elevation] = pattern (h, 2e9, 0, 1:1:360);
Compute the maximum and the minimum value of the radiation pattern and the elevation angle.
pattern_max = max(max(pat))
pattern_max = 8.6937
pattern_min = min(min(pat))
pattern_min = -11.3099
elevation_max = max(elevation)
elevation_max = 360
elevation_min = min(elevation)
elevation_min = 1
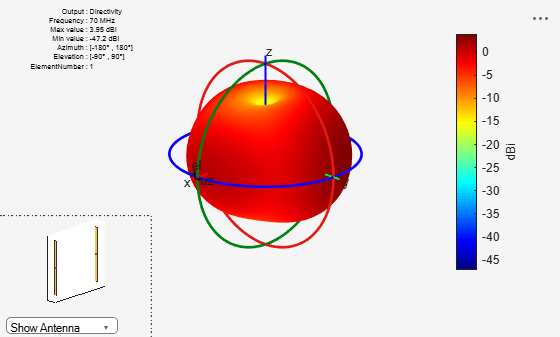
Embedded Element Pattern of Linear Array
Calculate the embedded element pattern of a linear array. Excite the first antenna element in the array. Terminate all the other antenna elements using a 50-ohm resistance.
l = linearArray;
pattern(l, 70e6, ElementNumber=1, Termination=50);
Directivity Value of Helix Antenna
Calculate the directivity of a helix antenna.
h = helix;
D = pattern(h, 2e9, 0, 1:1:360);
View the first five directivity values.
Dnew = D(1:5)
Dnew = 5×1

   -6.3106
   -6.0999
   -5.8759
   -5.6403
   -5.3951
Radiation Pattern of Helix Antenna
Plot the radiation pattern of a helix antenna with transparency specified as 0.5.
p = PatternPlotOptions
p =
  PatternPlotOptions with properties:

      Transparency: 1
         SizeRatio: 0.9000
    MagnitudeScale: []
     AntennaOffset: [0 0 0]
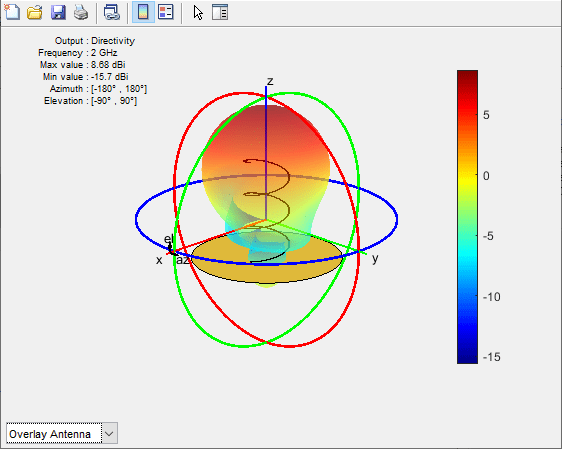
p.Transparency = 0.5;
ant = helix;
pattern(ant,2e9,patternOptions=p)
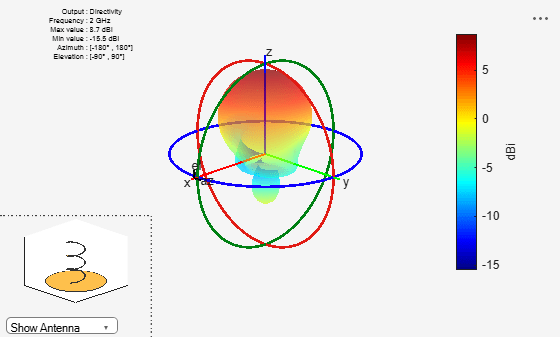
To understand the effect of Transparency, chose Overlay Antenna in the radiation pattern plot.
This option overlays the helix antenna on the radiation pattern.
Radiation Pattern of Dipole Antenna
Plot radiation pattern of dipole antenna in rectangular cartesian co-ordinate system.
pattern(dipole, 70e6:10e6:100e6, 0, 90, CoordinateSystem="rectangular")
View the directivity values at 0° azimuth and 90° elevation.
D = pattern(dipole, 70e6:10e6:100e6, 0, 90, CoordinateSystem="rectangular")D = 4×1
-49.2718
-50.6523
-51.9123
-53.1409
Compare Gain and Realized Gain of Radial Monopole Antenna
Visualize gain plot of radial monopole antenna.
pattern(monopoleRadial,75e6,Type="gain")
Visualize gain plot of radial monopole antenna.
pattern(monopoleRadial,75e6,Type="realizedgain")
Input Arguments
Output Arguments
References
[1] Makarov, Sergey N. Antenna and EM Modeling in MATLAB. Chapter3, Sec 3.4 3.8. Wiley Inter-Science.
[2] Balanis, C.A. Antenna Theory, Analysis and Design, Chapter 2, sec 2.3-2.6, Wiley.
Version History
Introduced in R2015a
You can also select a web site from the following list:
Americas
- América Latina (Español)
- Canada (English)
- United States (English)
Europe
- Belgium (English)
- Denmark (English)
- Deutschland (Deutsch)
- España (Español)
- Finland (English)
- France (Français)
- Ireland (English)
- Italia (Italiano)
- Luxembourg (English)
- Netherlands (English)
- Norway (English)
- Österreich (Deutsch)
- Portugal (English)
- Sweden (English)
- Switzerland
- United Kingdom (English)